.png?width=375&height=100&name=WebPage%20logo%20with%20curves%202026%20(8).png)
Texas Science Teacher Resource Hub
Free scope and sequences, TEKS breakdowns, phenomenon ideas, and engagement activities for the 2024 Texas science standards.

🚀 Jump to Your Grade
Pick your grade level and go straight to your TEKS standards, aligned resources, and teaching tools.
-
4th
→4th Grade Science20 standards • Matter, Earth, Energy & more
-
5th
→5th Grade Science19 standards • Matter, Ecosystems, Space & more
-
6th
→6th Grade Science24 standards • Forces, Energy, Matter & more
-
7th
→7th Grade Science27 standards • Cells, Chemistry, Earth & more
-
8th
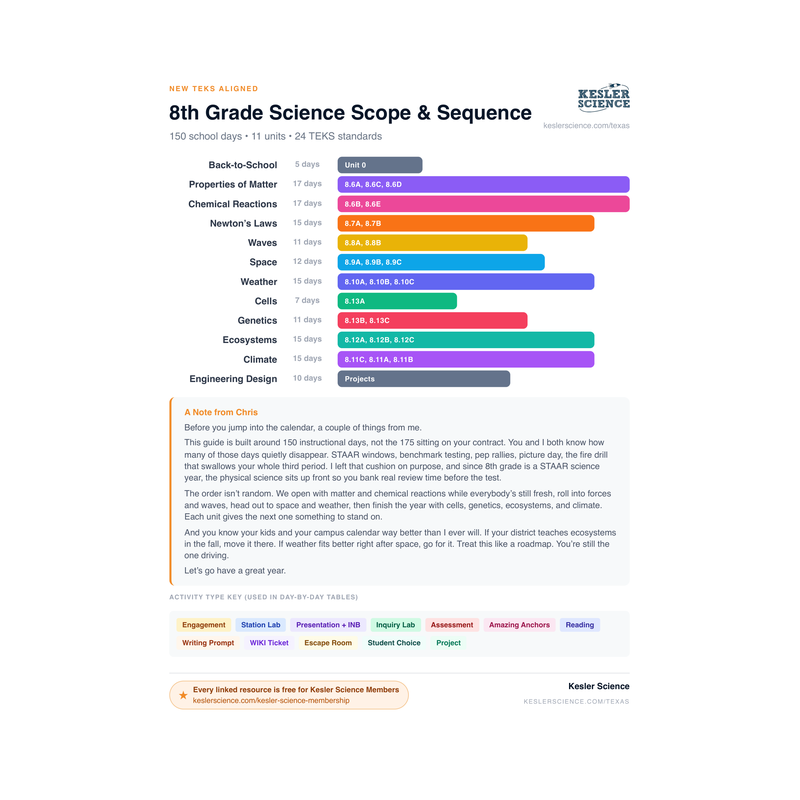
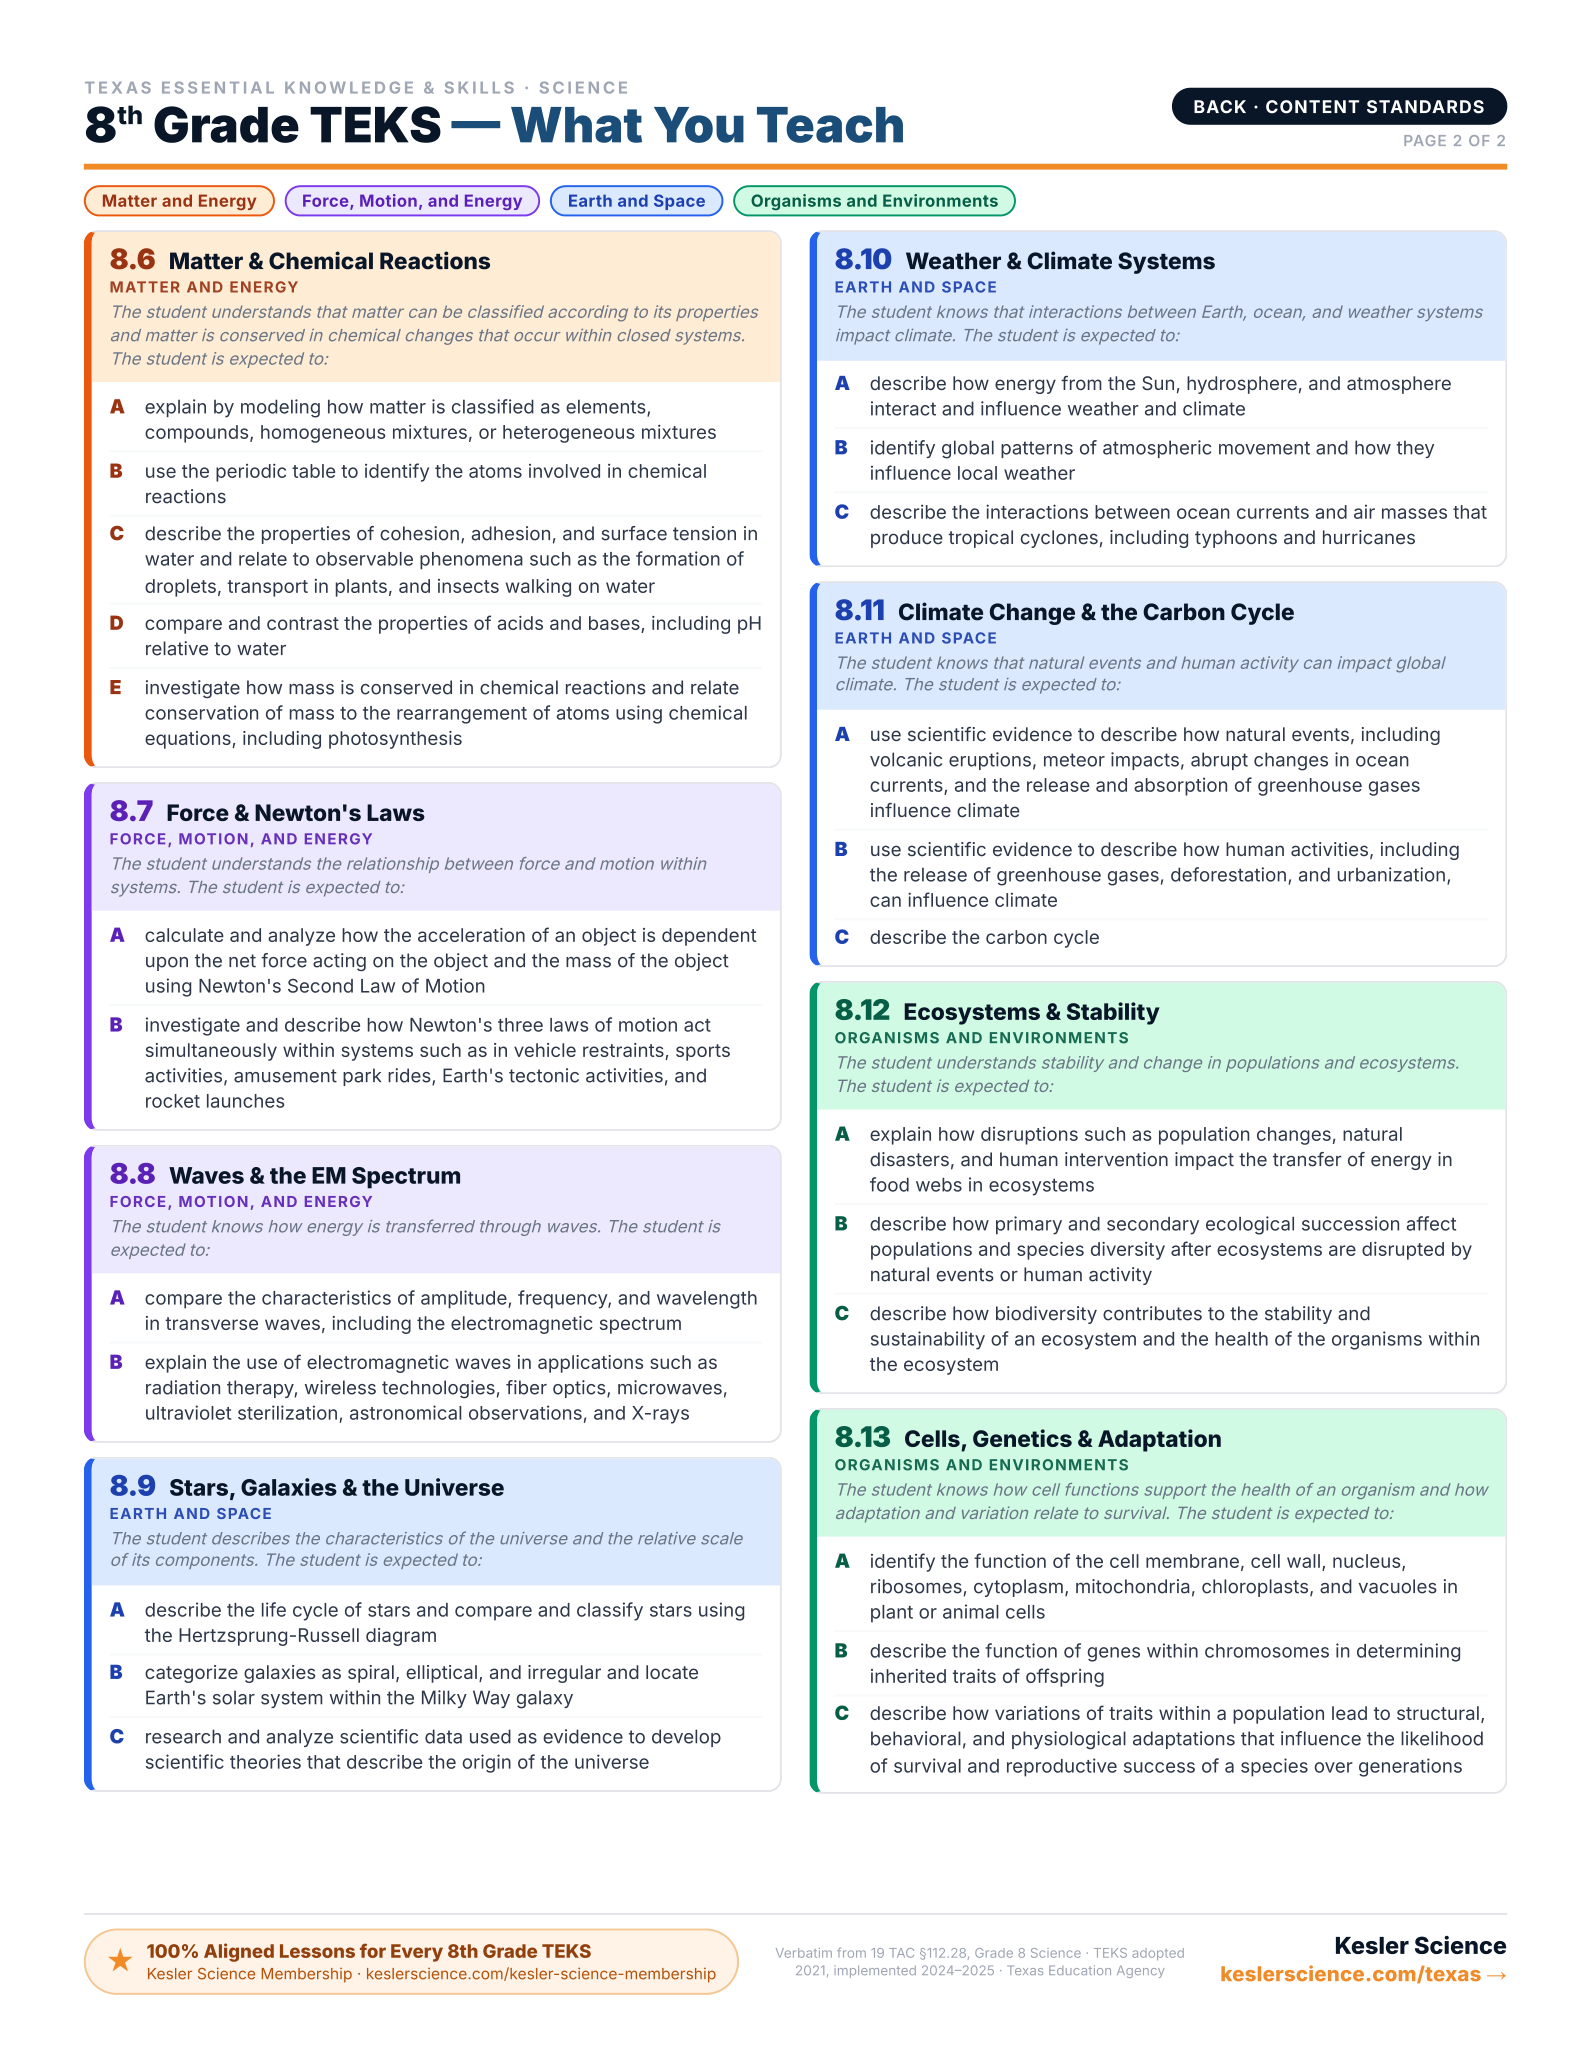
→8th Grade Science24 standards • Newton's Laws, Space, Genetics & more
8th Grade TEKS Standards
Click any standard to see what it means, how to teach it, where students get stuck, and aligned resources.
Classifying Stars
"Describe the life cycle of stars and compare and classify stars using the Hertzsprung-Russell diagram."
💡 What This Standard Actually Means
"Describe" and "compare and classify". This standard has two parts. First, students describe the life cycle of stars, from formation through their final stages. Second, students compare and classify stars using the Hertzsprung-Russell (H-R) diagram. There is no calculating star distances or deriving equations here. Students should be able to walk through the stages of a star's life, then read an H-R diagram and group stars into categories like main sequence, red giants, supergiants, and white dwarfs based on where they fall. Instruction can take many forms, such as life-cycle sequence diagrams, labeled H-R diagrams, and card sorts that pair star traits with their classification.
The Hertzsprung-Russell (H-R) diagram is the tool astronomers use to classify stars. Temperature runs along the x-axis (hot stars on the left, cooler stars on the right) and luminosity, which is a measure of how much energy a star actually gives off, runs up the y-axis. When thousands of stars are plotted on this chart, they don't scatter randomly. They fall into distinct groups.
The biggest group is the main sequence, a diagonal band running from hot, bright blue stars in the upper left down to cooler, dim red stars in the lower right. The Sun sits on the main sequence as a G-type star. Above the main sequence are red giants and supergiants, stars that are cooler on the surface but huge and extremely luminous. Down in the lower left are white dwarfs, small dense stars that are hot but faint.
A star's color is tied to its surface temperature. Blue stars are the hottest (often above 10,000 K), white and yellow stars are in the middle (around 5,000 to 10,000 K), orange stars are cooler still (around 3,700 to 5,200 K), and red stars are the coolest (around 3,000 K). This is the opposite of what most students expect, since red usually signals "hot" in everyday life. The H-R diagram also tells a story about stellar life cycles: stars spend most of their lives on the main sequence, then move off as they run out of hydrogen and expand into giants before ending up as white dwarfs, neutron stars, or black holes depending on their original mass.
The thing that unlocked this for me was treating the H-R diagram like a graph of personalities, not a graph of points. I'd pass out a blank H-R diagram and a deck of cards with stars on them (Sun, Sirius, Betelgeuse, Rigel, Proxima Centauri, a random white dwarf). Kids placed the cards based on color and brightness, then I'd pull the class together and we'd circle the main sequence, the giant region, and the white dwarf corner. Once they've physically moved the cards, the diagram stops being a mysterious chart and starts being a map. From there, reading any H-R diagram feels natural.
⚠️ Misconceptions Your Students May Have
These are some of the most common misconceptions. Knowing what to look for can help you get ahead of them.
"Red stars are the hottest because red means hot"
In everyday life, a red stove coil feels hot. In astronomy, the relationship flips. Blue stars are the hottest, with surface temperatures often above 10,000 K. Red stars are the coolest visible stars, often around 3,000 K. White and yellow stars fall in between. The color comes from the peak wavelength of light a star emits, and hotter objects emit shorter (bluer) wavelengths.
"The brightest stars I see at night are the most powerful stars"
How bright a star looks from Earth depends on how close it is. Sirius looks like the brightest star in our night sky, but it's bright to us mostly because it's only about 8.6 light-years away. A distant supergiant like Rigel actually gives off far more energy, but its distance makes it appear dimmer. The H-R diagram uses luminosity (actual energy output) rather than how bright a star looks from Earth.
"All stars are basically the same"
Stars vary enormously in size, temperature, color, and luminosity. A red dwarf can be a fraction of the Sun's size. A red supergiant like Betelgeuse could swallow the entire inner solar system if placed where the Sun is. The whole point of the H-R diagram is to show that stars fall into distinct categories based on these differences.
"The Sun is a small, average star"
The Sun is an average star in the sense that it's a main-sequence star, but it's actually more massive than about three-quarters of the stars in the Milky Way. Most stars in the galaxy are red dwarfs, which are smaller and cooler than the Sun. Calling the Sun "average" can cause students to underestimate how it compares to the most common stars out there.
📓 Teaching Resources for 8.9A
These resources are aligned to this standard.


100% Aligned Lessons for Every TEKS You Teach
Kesler Science Plus puts thousands of ready-to-teach lessons and activities in your hands, so you can boost engagement and get your planning time back. Trusted by schools and districts all over the great state of Texas.
🌎 Phenomenon Ideas for 8.9A
Use these real-world phenomena to anchor your lesson. Show students the phenomenon first, let them wonder, then build toward Classifying Stars as the explanation.
The Colors of Orion
Look at the constellation Orion on a clear winter night. Betelgeuse, the star at Orion's shoulder, glows a deep reddish-orange. Rigel, at Orion's foot, shines bright blue-white. These two stars are both famous and easy to see, but they look like completely different colors. Those colors aren't random, and they aren't a trick of the eye. They tell astronomers something specific about each star.
"If both Betelgeuse and Rigel are stars, why does one look red and the other blue? What property of the star could a color be pointing to?"
Sirius Is Bright, But Not for the Reason You Think
Sirius is the brightest star in our night sky. But Sirius isn't actually the most powerful star we can see. It looks so bright because it's one of our closest neighbors, sitting about 8.6 light-years away. Meanwhile, Rigel is about 860 light-years from Earth and gives off far more energy than Sirius does, but it looks dimmer to us.
"Why doesn't 'brightest from Earth' mean 'most powerful star'? What are two different ways we could describe how bright a star really is?"
The Sun Is Not Special, and That's the Point
When astronomers plot the Sun on the Hertzsprung-Russell diagram, it sits on the main sequence as a yellowish G-type star. It's not the brightest star on the chart. It's not the largest. It's not the hottest. It fits neatly into a well-populated group with billions of other stars. The H-R diagram lets astronomers compare our star to every other star we can measure.
"If the Sun is a main-sequence star, what should we expect to be true about its temperature and luminosity compared to a red giant like Betelgeuse?"
💡 Free Engagement Ideas for 8.9A
Build a Class H-R Diagram on the Wall
Tape a large piece of butcher paper to the wall and mark the axes (temperature across, luminosity up). Give each student a printed "star card" with a real star's temperature, luminosity, and color. Students take turns placing their star in the correct position. Once every star is up, circle the main sequence, red giant region, and white dwarf corner together.
Color-Temperature Sort With Flame and Incandescent Sources
Show short video clips of a candle flame, a red-hot stove coil, and a blue gas flame (like on a gas range). Have students rank the three by temperature using only the color. Discuss why the blue flame is hotter than the red one. Then connect the pattern to star colors on the H-R diagram. No open flames needed in class, the video is enough.
Card Sort: Star Profiles
Print index cards with star names on one side (Sun, Sirius, Betelgeuse, Rigel, Proxima Centauri, Arcturus, Vega, Polaris, Sirius B) and their properties on the back. Students work in pairs to sort cards into four piles: main sequence, red giants, supergiants, and white dwarfs. Walk around and ask each pair to justify their placements with data.
Life Cycle Flip Book
Have students fold a piece of paper in half three times to make an 8-panel flip book. Each panel shows one stage of a Sun-mass star's life (nebula, protostar, main sequence, red giant, planetary nebula, white dwarf, black dwarf). On the last page, they draw where each stage would sit on an H-R diagram. Flipping the pages ties the life cycle to the diagram position.
🎯 What Approaches, Meets, and Masters Thinking Look Like
Here is what student thinking at each level looks like on this one task, so you know what to look for and how to move a student up.
A Hertzsprung-Russell diagram shows two stars: a hot blue star in the upper left and a cool red star in the lower right. Classify each star, then explain your reasoning using the star's color, its temperature, and its position on the diagram.
- Each star placed in the correct group, with both stars identified as main-sequence stars in this case.
- Reading the x-axis correctly: stars on the left are hotter, stars on the right are cooler.
- Reading the y-axis correctly: stars higher up are more luminous (give off more energy), stars lower down are fainter.
- Color tied to temperature the right way: blue is hotter, red is cooler.
- An explanation that uses position on the diagram to back up the reasoning, not just the star's color alone.
- The blue star correctly called the hotter of the two and the red star the cooler. That is the easiest place to slip, because "red" makes students want to call it hot.
Both of these are stars on the chart. The blue star is up high, so it gives off a lot of light. The red star is the hotter one because red means really hot, like fire, so it should be the warmest of the two.
Both stars are main-sequence stars, because they fall along the diagonal band. The blue star is in the upper left, so it is hot and very luminous. The red star is in the lower right, so it is cooler and fainter. Color matches temperature: blue is hotter and red is cooler. The blue star's high position also means it gives off more energy than the red one.
Both stars are on the main sequence. The blue star is upper left, so it is hot and luminous. The red star is lower right, so it is cooler and fainter. The reason position works is that the x-axis is temperature and the y-axis is luminosity, so where a star lands tells you two separate things.
That is how I would classify a star nobody showed me. Picture a red giant: it is red, so its surface is cool, but it sits way up high on the right side of the chart because it is enormous and pours out a lot of energy. So you can have two red stars, my lower-right red star and this red giant, with about the same cool temperature but completely different luminosity. Surface temperature and how much energy a star gives off are separate things, which is why I have to read both axes and not let the color decide everything.
Every 8th-Grade Science TEKS on One Page
The color-coded, front-and-back cheat sheet I wish I'd had — every standard, organized by reporting category. Print it and reference it all year long. This will be your new favorite document!
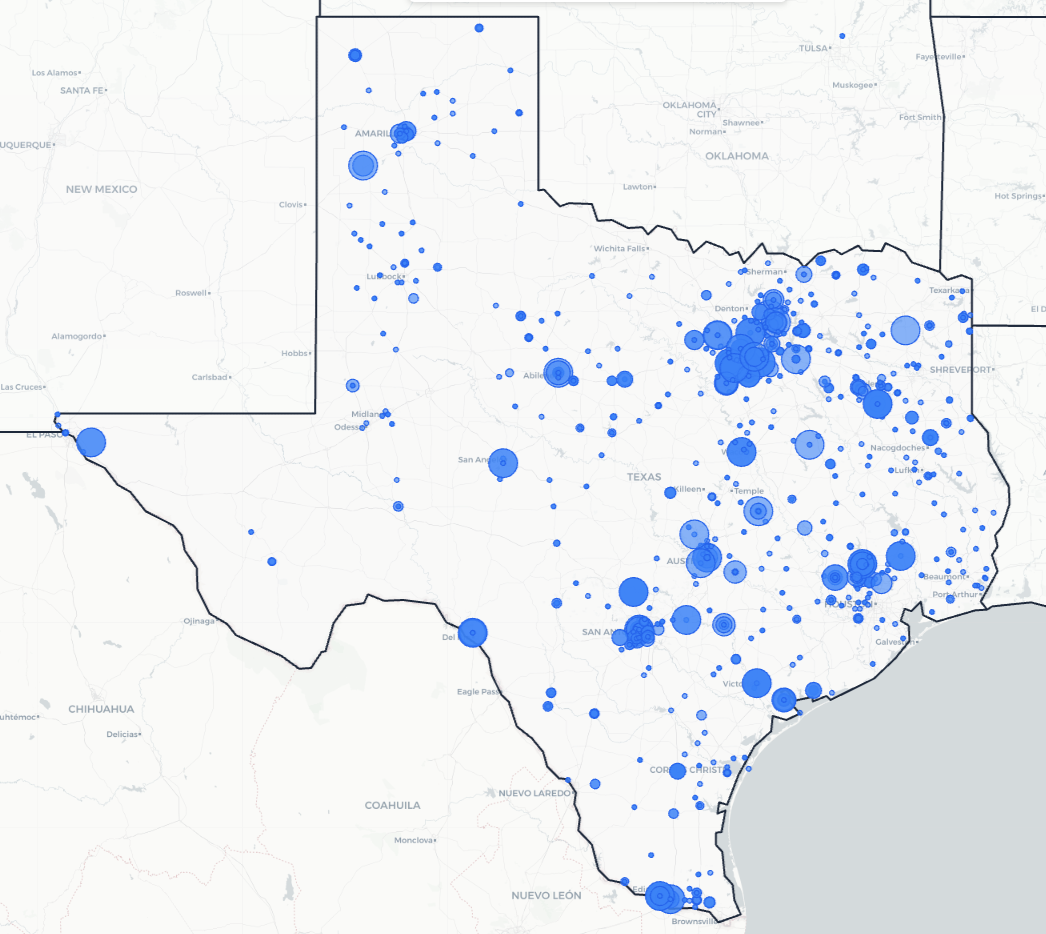
Trusted Across Texas
From the Rio Grande Valley to the Panhandle, Texas science teachers are using Kesler Science to save time and engage students.
Texas Schools and Districts
Love Kesler Science
What Teachers Are Saying
Give Your Science Teachers Everything They Need
School and district licenses give your teachers access to every resource they need, including station labs, inquiry labs, anchoring phenomena, presentations, escape rooms, and much more. One purchase covers the grade levels you need.
- PO-friendly. We accept purchase orders
- Volume discounts for 11+ teachers
- Complimentary Kesler Science Plus orientation for 4+ teachers
- Three free implementation PD sessions for departments of 11+
- Aligned to the 2024 TEKS standards


See It in Action
Book a walkthrough and we'll show you how Kesler Science fits your campus.
Book Demo CallNo pressure, no hard sell