.png?width=375&height=100&name=WebPage%20logo%20with%20curves%202026%20(8).png)
Texas Science Teacher Resource Hub
Free scope and sequences, TEKS breakdowns, phenomenon ideas, and engagement activities for the 2024 Texas science standards.

🚀 Jump to Your Grade
Pick your grade level and go straight to your TEKS standards, aligned resources, and teaching tools.
-
4th
→4th Grade Science20 standards • Matter, Earth, Energy & more
-
5th
→5th Grade Science19 standards • Matter, Ecosystems, Space & more
-
6th
→6th Grade Science24 standards • Forces, Energy, Matter & more
-
7th
→7th Grade Science27 standards • Cells, Chemistry, Earth & more
-
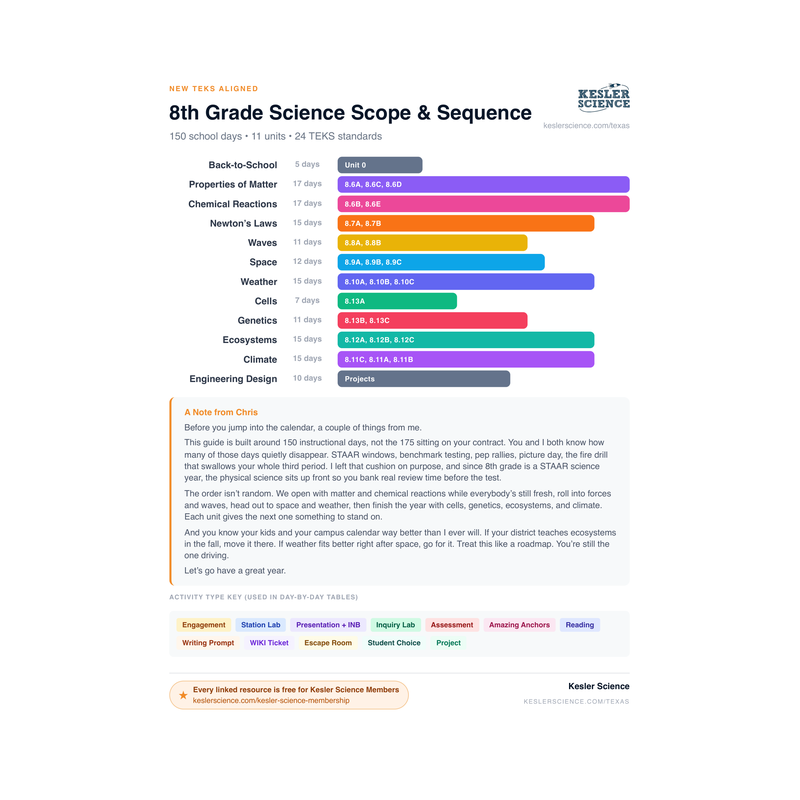
8th
→8th Grade Science24 standards • Newton's Laws, Space, Genetics & more
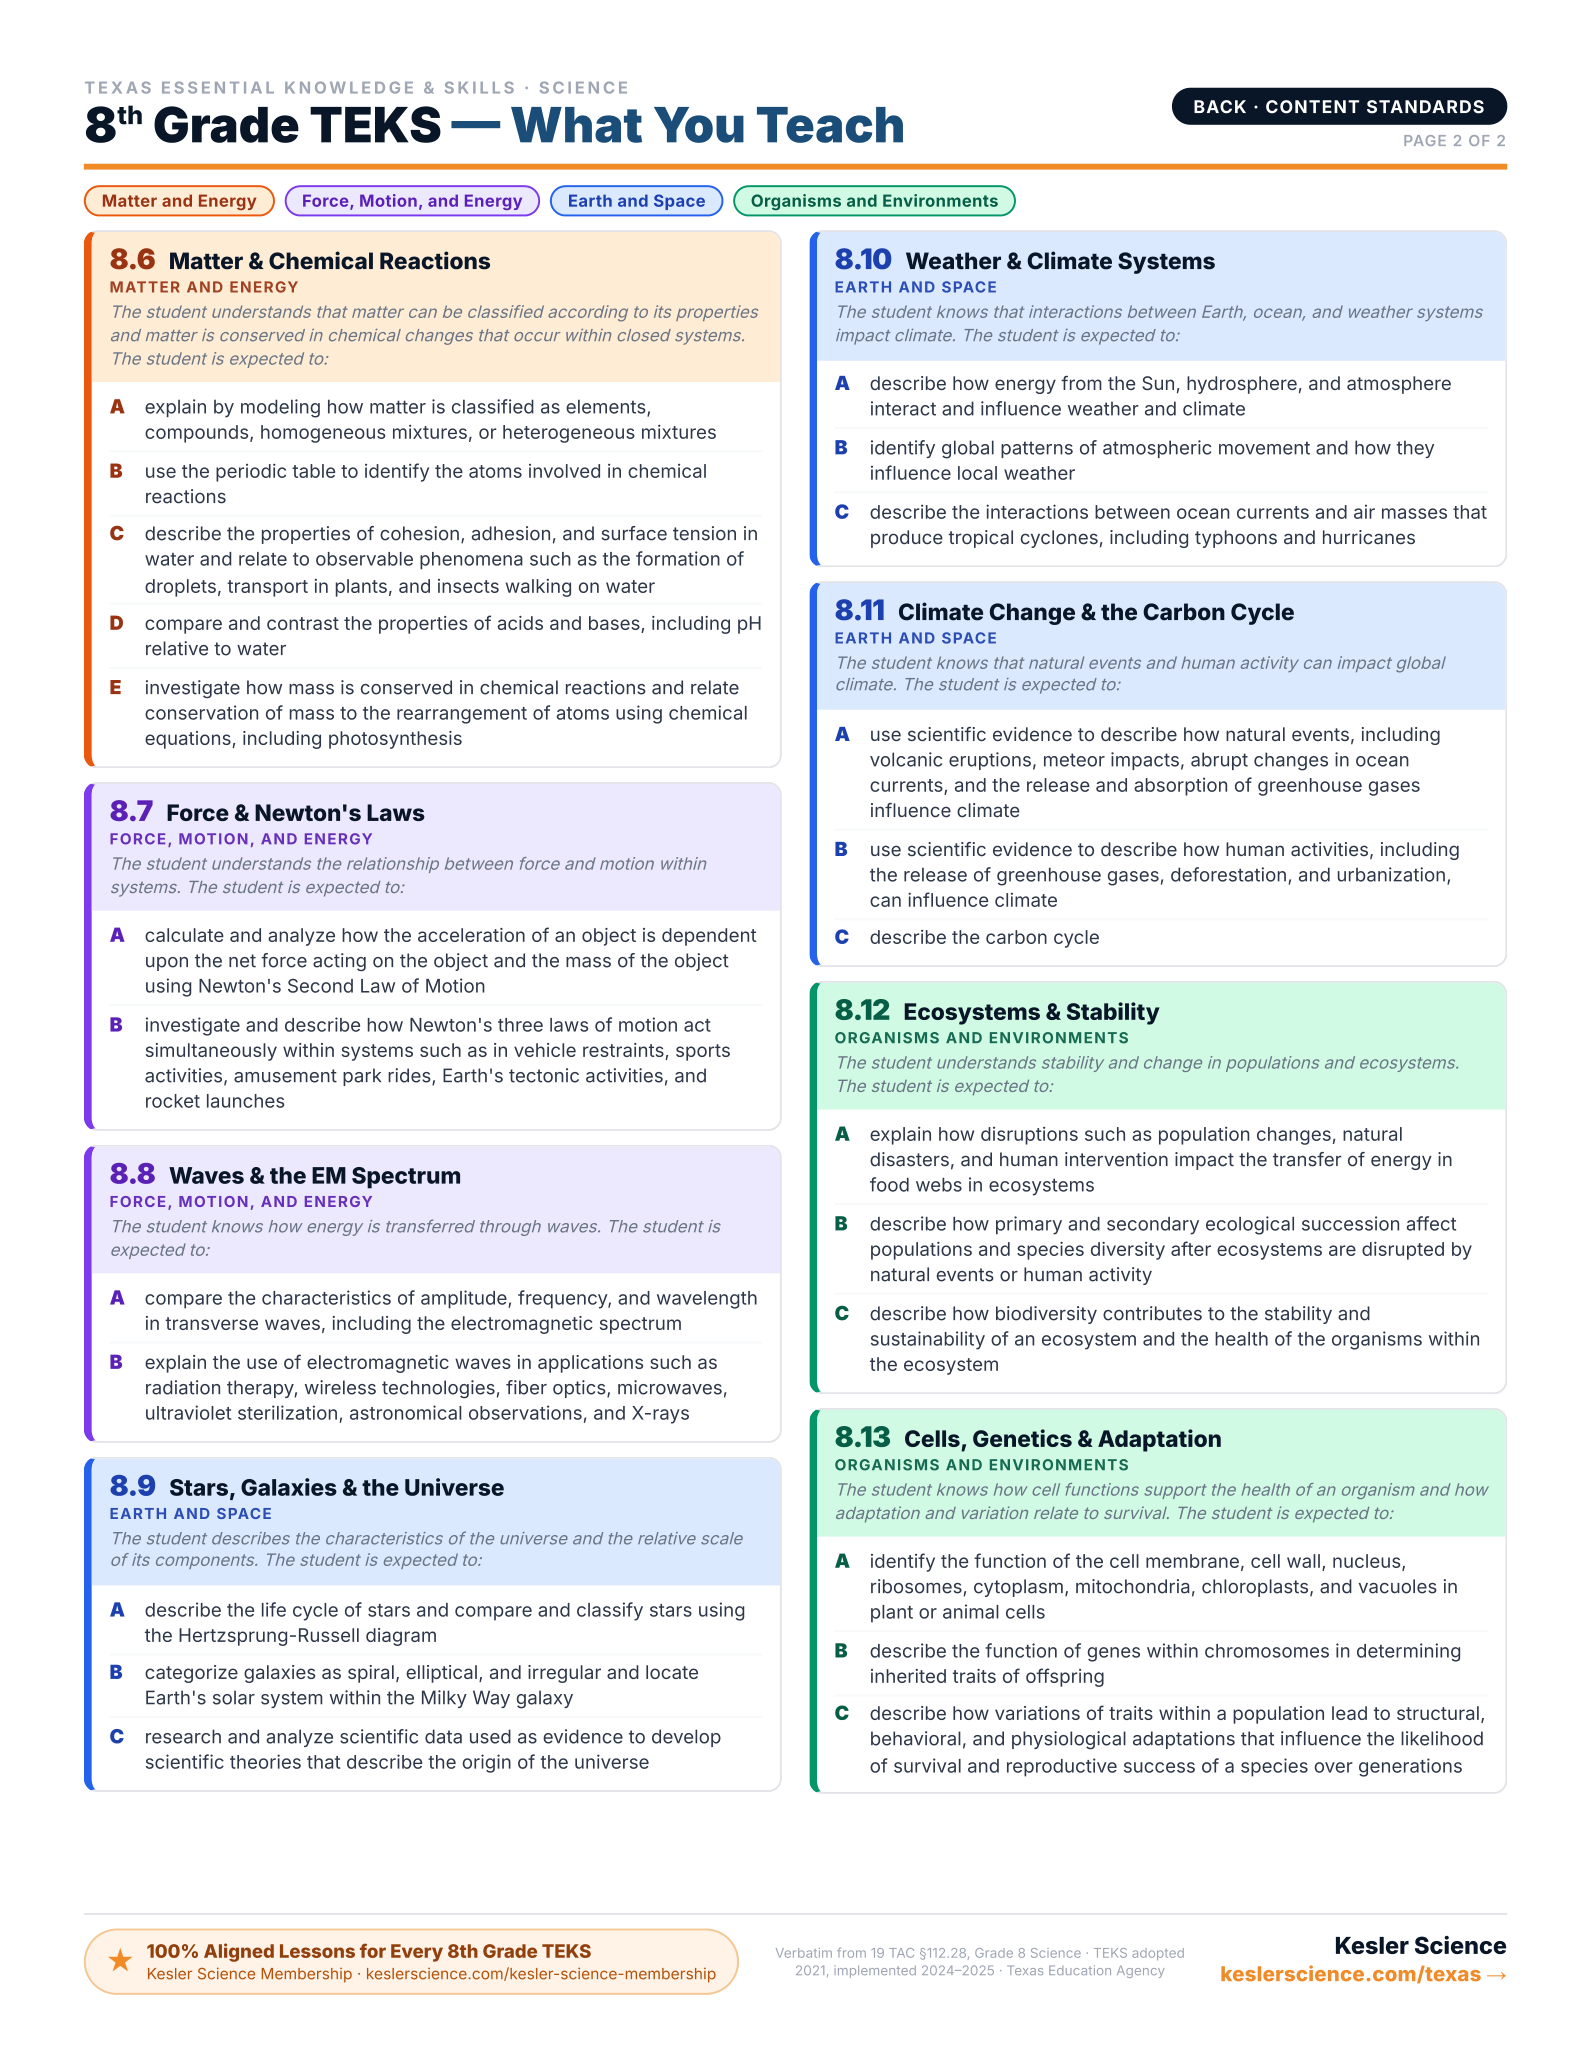
8th Grade TEKS Standards
Click any standard to see what it means, how to teach it, where students get stuck, and aligned resources.
Genes
"Describe the function of genes within chromosomes in determining inherited traits of offspring."
💡 What This Standard Actually Means
"Describe". Students explain how genes work, what they are, where they sit, and how they pass traits from parents to offspring. The focus is the chain of three ideas: genes are segments of DNA, genes sit on chromosomes, and the genes a child inherits from each parent determine that child's traits. Students should be able to say (or write) that a gene is the instruction, a chromosome is the structure that carries many genes, and the combination of genes from both parents is what shows up in the offspring. Keep the focus on function and inheritance, Punnett square mechanics and dominant/recessive math are not part of this standard, so save them for your heredity and genetics lessons.
Genes are segments of DNA that carry the instructions for an organism's traits. Each gene sits on a specific location on a chromosome. A chromosome is a long, tightly coiled strand of DNA that holds many genes. Humans have 23 pairs of chromosomes (46 total) inside the nucleus of nearly every cell, one set inherited from each parent.
Three ordered terms keep students straight: DNA is the molecule, genes are the instructions written in that molecule, and chromosomes are the structures that carry many genes. Lock that order in early so students stop using the three words interchangeably.
Inherited traits come from the genes an organism gets from each parent. Offspring receive one set of chromosomes from each parent. The genes on those chromosomes determine traits like fur color in rabbits, seed shape in peas, or flower color in plants. Those traits pass on because the parents' genes, not their life experiences, are what get copied into the offspring. The function of genes within chromosomes is to carry and pass on those instructions from one generation to the next. Save the math of predicting offspring (Punnett squares, alleles, genotype vs. phenotype) for your heredity and genetics lessons, where it belongs.
This standard tripped my students up because it sounds abstract, "the function of genes within chromosomes", and they wanted concrete. The move that worked for me was an ordering exercise on day one. I'd put four words on the board (cell, nucleus, chromosome, gene) and ask groups to put them in order from largest to smallest. They argued, they guessed, and when they finally landed on the nesting (cell → nucleus → chromosome → gene), the function of genes "within" chromosomes stopped being abstract. After that, I'd point to a single trait, pea plant flower color, fur length in rabbits, seed shape, and trace it together: gene on a chromosome, copy from each parent, instructions show up in the offspring. Concrete trait, clear path. Save the probability math for your heredity and genetics lessons.
⚠️ Misconceptions Your Students May Have
These are some of the most common misconceptions. Knowing what to look for can help you get ahead of them.
"DNA is the same thing as a gene"
DNA is the molecule that carries genetic information. A gene is a specific section of DNA that codes for a particular trait. DNA is the material. Genes are the messages written in that material. Chromosomes are long, tightly coiled strands of DNA that hold many genes. Rank them from smallest to largest: DNA base, gene, chromosome.
"Skills or habits you pick up during life get passed down to your kids"
This one is the classic Lamarck trap. Learning piano, getting a tattoo, building muscle at the gym, none of that rewrites the DNA in your reproductive cells. Only the information already inside your genes gets copied and passed to offspring. The function of genes within chromosomes is to carry inherited instructions, not lived experiences. If a trait isn't written into the gene, it isn't getting handed down.
"Genes are the things you see, like eye color or height"
The trait isn't the gene. The gene is the instruction. A gene is a stretch of DNA sitting on a chromosome, and its job is to tell the cell what protein to build. The visible trait, like eye color or height, is what shows up once those proteins do their work. Students who keep mixing them up will struggle later, so I'd hammer the chain on day one: gene on a chromosome → protein gets built → trait you can see.
"Identical twins are identical, so anything different about them must be in their genes too"
Identical twins do inherit the same set of genes from their parents. That part is real. But the gene is the instruction, not the final outcome. Environment, food, sleep, injuries, and life experience all shape how those instructions show up. Two siblings can carry the same gene for height and still end up different heights. The genes are what got inherited. What you see is gene plus everything that happened after.
📓 Teaching Resources for 8.13B
These resources are aligned to this standard.


100% Aligned Lessons for Every TEKS You Teach
Kesler Science Plus puts thousands of ready-to-teach lessons and activities in your hands, so you can boost engagement and get your planning time back. Trusted by schools and districts all over the great state of Texas.
🌎 Phenomenon Ideas for 8.13B
Use these real-world phenomena to anchor your lesson. Show students the phenomenon first, let them wonder, then build toward Genes as the explanation.
A Litter of Puppies That Look Nothing Alike
A single litter of puppies is born to the same mom and the same dad on the same day. One is black. One is yellow. One has a splotchy brown coat. One has floppy ears, another has ears that stand straight up. Same parents, same litter, totally different puppies.
"The parents passed on genes for coat color and ear shape to every puppy. Why didn't every puppy come out looking the same? What's the job of a gene in this story?"
A Trait That Skips a Generation in Pea Plants
A gardener grows tall pea plants and lets them self-pollinate. Some of the offspring come out short, even though both parents were tall. Let those plants keep reproducing and the tallness shows back up a generation later. The same trait keeps disappearing and reappearing across generations of the very same kind of plant.
"How can a trait vanish in one generation and come back in the next? What has to be inside the plant's cells for that trait to keep getting passed along?"
Two Black Cats, One White Kitten
A pair of solid black cats has a litter, and one kitten comes out pure white. Neither parent is white, and neither grandparent looked white either. The white kitten still showed up, and it traces back to a specific gene on a specific chromosome that both parents happened to carry without showing it.
"If neither parent is white, how can their kitten be? What does this tell you about what a gene actually IS and what its job is inside the chromosome?"
💡 Free Engagement Ideas for 8.13B
Gene-to-Trait Card Walk
Lay out a set of three-card chains around the room. Each chain has a gene card, a protein card, and a trait card (gene for melanin → melanin protein → eye/skin/hair color, gene for keratin → keratin protein → hair and nails, gene for lactase → lactase enzyme → can digest milk). Groups walk the chain in order, then build one of their own from a list of "mystery" genes. Locks in the idea that a gene's function is to carry the instructions for a protein that produces a trait. No probability math, no Punnett squares.
Build a Trait Map
Hand each group a list of 10 traits (curly hair, freckles, dimples, attached earlobes, lactose tolerance, eye color, blood type, height, fingernail shape, hair color). Their job is to write what they think the gene's actual job is for each one (what is the gene telling the body to make or do?). They'll struggle, and that's the point. The struggle forces them to stop thinking of the gene as the trait and start thinking of it as a set of instructions for building the trait. Share out and clean up misconceptions as a class.
Family Trait Tracker (Inherited vs. Environmental)
Send students home with a one-pager. They survey at least three family members on a list of traits: tongue-rolling, attached earlobes, widow's peak, dimples, hair color, plus a few "trick" entries (scars, sunburn tan, ability to play guitar, accent). Back in class, students sort each trait into "this is in the genes" or "this came from the environment." Discuss the disagreements. Great way to surface the misconception that anything physical about you must be inherited.
Model a Chromosome With Beads
Give each group a long piece of string and different-colored beads. Each bead is a different gene sitting on the chromosome. Students build a chromosome, label which bead is the gene for which trait (eye color, hair texture, blood type, etc.), then pair their chromosome with another group's "matching" chromosome from the other parent. Concrete, hands-on way to show that a chromosome is the structure and the genes are the instructions sitting on it.
🎯 What Approaches, Meets, and Masters Thinking Look Like
Here is what student thinking at each level looks like on this one task, so you know what to look for and how to move a student up.
A puppy is born with a long, curly coat just like its mother. Describe the function of genes within chromosomes in passing this trait to the puppy. In your answer, explain what a gene is, where it sits, and how the genes the puppy inherited from each parent determined its coat.
- A gene defined as a segment of DNA that carries an instruction for a trait, not as the visible trait itself.
- Genes correctly placed on chromosomes, with the chromosome described as a structure that carries many genes.
- The order of the three terms kept straight: DNA is the molecule, genes are the instructions, chromosomes are the structures that hold many genes.
- The puppy receiving one set of chromosomes from each parent, so its genes come from both the mother and the father.
- The trait (the curly coat) explained as the result of inherited genes, not of anything the parents did during their lives.
- A clear statement that the function of genes within chromosomes is to carry and pass instructions from one generation to the next.
- The line between inherited genes and life experience handled correctly: only what is written in the genes gets passed on. That is the easiest place to slip.
The puppy got its curly coat from its parents because it's their baby. Genes are inside the cells and they pass down traits. The mom had a curly coat her whole life, so her body learned to grow curly hair and she passed that on to the puppy. That's why the puppy is curly too.
A gene is a segment of DNA that carries the instruction for a trait, like coat type. Genes sit on chromosomes, which are long coiled strands of DNA that hold many genes. The puppy got one set of chromosomes from its mother and one set from its father, so it inherited genes from both parents. The genes it inherited carried the instruction for a long, curly coat, so that's the coat it grew. The mom's curly coat didn't pass down because of how she lived. It passed down because the gene for curly coat was copied into the puppy.
A gene is a segment of DNA that holds the instruction for a trait. Genes are lined up along chromosomes, and a chromosome is a tightly coiled strand of DNA that carries many genes. The puppy inherited one set of chromosomes from its mother and one from its father, so the genes on those chromosomes are what determined its coat. The reason the puppy is curly is that the instruction for a curly coat was inside the genes it received, and those genes were copied into the puppy. The trait you see is the result of the instruction, not the instruction itself.
That's also how I know a weightlifter's baby won't be born with big muscles. The parent built those muscles during life, but that change was never written into the genes in their reproductive cells. Genes only carry and pass on the instructions they already hold, so the only things that get inherited are the ones coded in the genes, no matter what the parent did to their body afterward.
Every 8th-Grade Science TEKS on One Page
The color-coded, front-and-back cheat sheet I wish I'd had — every standard, organized by reporting category. Print it and reference it all year long. This will be your new favorite document!
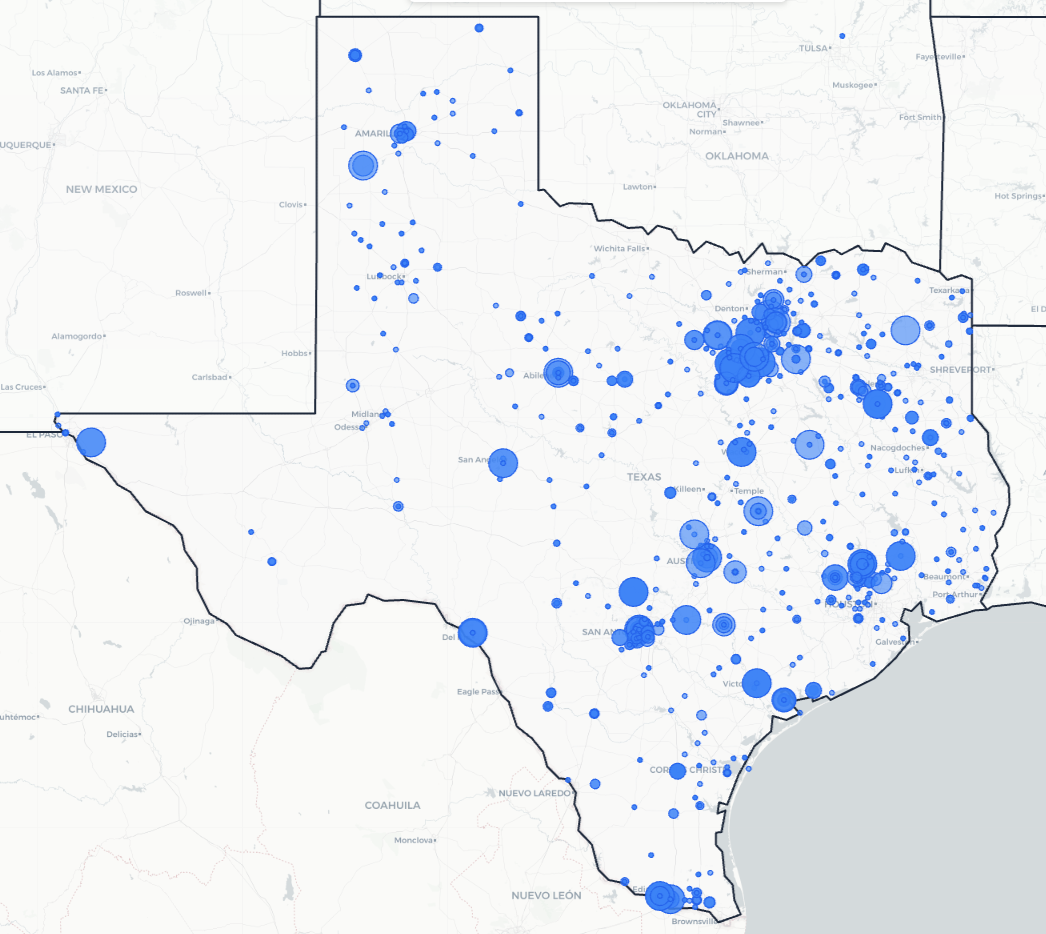
Trusted Across Texas
From the Rio Grande Valley to the Panhandle, Texas science teachers are using Kesler Science to save time and engage students.
Texas Schools and Districts
Love Kesler Science
What Teachers Are Saying
Give Your Science Teachers Everything They Need
School and district licenses give your teachers access to every resource they need, including station labs, inquiry labs, anchoring phenomena, presentations, escape rooms, and much more. One purchase covers the grade levels you need.
- PO-friendly. We accept purchase orders
- Volume discounts for 11+ teachers
- Complimentary Kesler Science Plus orientation for 4+ teachers
- Three free implementation PD sessions for departments of 11+
- Aligned to the 2024 TEKS standards
See It in Action
Book a walkthrough and we'll show you how Kesler Science fits your campus.
Book Demo CallNo pressure, no hard sell