.png?width=375&height=100&name=WebPage%20logo%20with%20curves%202026%20(8).png)
Texas Science Teacher Resource Hub
Free scope and sequences, TEKS breakdowns, phenomenon ideas, and engagement activities for the 2024 Texas science standards.

🚀 Jump to Your Grade
Pick your grade level and go straight to your TEKS standards, aligned resources, and teaching tools.
-
4th
→4th Grade Science20 standards • Matter, Earth, Energy & more
-
5th
→5th Grade Science19 standards • Matter, Ecosystems, Space & more
-
6th
→6th Grade Science24 standards • Forces, Energy, Matter & more
-
7th
→7th Grade Science27 standards • Cells, Chemistry, Earth & more
-
8th
→8th Grade Science24 standards • Newton's Laws, Space, Genetics & more
8th Grade TEKS Standards
Click any standard to see what it means, how to teach it, where students get stuck, and aligned resources.
Disruptions in Ecosystems
"Explain how disruptions such as population changes, natural disasters, and human intervention impact the transfer of energy in food webs in ecosystems."
💡 What This Standard Actually Means
"Explain". Students are tracing how a disruption ripples through a food web and changes the way energy moves between organisms. The standard's "such as" list signals where to focus your students: population changes, natural disasters, and human intervention. Students should be able to look at a food web diagram, picture what happens when one piece is disrupted, and walk through the cascading effect on every level above and below. Instruction can take many forms, such as yarn food webs, cause-and-effect chain diagrams, energy pyramid models, and case studies of real ecosystems where a disruption rerouted energy flow.
Every ecosystem runs on energy that starts at the sun. Producers like grass, trees, and algae capture solar energy through photosynthesis. Primary consumers eat the producers. Secondary and tertiary consumers eat other consumers. Decomposers break down what's left. The whole system is a connected web, not a single chain, and energy moves through it from one trophic level to the next.
The catch is that only about 10 percent of the energy at each level passes up to the next. The rest is lost as heat or used for the organism's own life functions. That's why food pyramids get smaller toward the top and why ecosystems can support far more producers than top predators. When a disruption hits (a drought kills off the grass, a hurricane wipes out a coastal marsh, a new highway cuts a deer population off from its food source, a top predator is removed), the path that energy used to take gets broken or rerouted. Populations above the disruption lose their energy source. Populations below it can explode without their predators, then overgraze the producers and crash the whole system. This cascading effect is why disruptions are rarely contained to one species.
The core understanding students should walk away with is that food webs are interconnected energy pipelines, and disruptions don't just affect one species. They redirect energy through the whole community. The best examples are the ones students can picture: what happens to a deer population when a drought kills the grass, or what happens to a prairie when wolves are removed and elk overgraze the willows.
I used to teach this with a static food web diagram on a worksheet and ask kids what would happen if you removed one species. They'd write a one-sentence answer and move on. The lesson never stuck. What finally worked was the yarn web on the floor. Each student got a card (sun, grass, grasshopper, mouse, snake, hawk, decomposer) and I'd hand out yarn to make every connection. We had a giant tangle of yarn across the carpet. Then I'd say, "Drought. Grass dies." The student holding "grass" sits down. Every student connected to that piece of yarn feels the slack. Then I'd ask, "Mouse, what just happened to your food source? Snake, what just happened to yours?" Kids who couldn't write a single sentence about energy flow on the worksheet were suddenly explaining the cascade out loud while sitting in a tangle of yarn. That visual made the standard click.
⚠️ Misconceptions Your Students May Have
These are some of the most common misconceptions. Knowing what to look for can help you get ahead of them.
"If you remove one species, the rest just adjust"
Food webs are tightly connected, and removing one species can ripple through the entire community. When wolves were removed from Yellowstone, the elk population grew unchecked, overgrazed willows and aspens along the riverbanks, and the loss of those plants reshaped streams and beaver populations. When wolves were brought back decades later, the willows recovered. One species can have outsized effects on the entire system, and "just adjusting" usually means another part of the web crashes.
"Energy in an ecosystem comes from food, not from the sun"
Almost every bit of energy in a food web traces back to the sun. Producers like grass, trees, and algae capture sunlight through photosynthesis and turn it into chemical energy that the rest of the ecosystem uses. When a deer eats grass, it's getting solar energy that the grass already converted. When a coyote eats the deer, the same energy is moving up another level. Disruptions to producers (drought, fire, deforestation) cut off the energy supply for everything above them.
"Disruptions only affect the species directly involved"
Disruptions move both up and down a food web. If a disease wipes out a deer population, the predators that eat them lose food, but the plants they used to graze on can grow back faster, which then changes the insects, birds, and other small animals that depend on those plants. The "domino effect" is real. The best way to see it is to draw arrows showing every connection from the disrupted species and trace what happens to each one.
"Top predators are bad for an ecosystem because they kill prey"
Top predators often stabilize the whole ecosystem. Without them, prey populations can grow unchecked, overeat the producers, and crash the system from the bottom up. Yellowstone is the classic case. So is the relationship between sea otters and kelp forests, where otters eat sea urchins and the urchins would otherwise mow down all the kelp. Removing a top predator usually does more damage to a food web than the predator ever did.
📓 Teaching Resources for 8.12A
These resources are aligned to this standard.


100% Aligned Lessons for Every TEKS You Teach
Kesler Science Plus puts thousands of ready-to-teach lessons and activities in your hands, so you can boost engagement and get your planning time back. Trusted by schools and districts all over the great state of Texas.
🌎 Phenomenon Ideas for 8.12A
Use these real-world phenomena to anchor your lesson. Show students the phenomenon first, let them wonder, then build toward Disruptions in Ecosystems as the explanation.
Wolves Bring the Willows Back
Wolves were wiped out of Yellowstone National Park by 1926. Without them, the elk population grew massively and stayed in the open river valleys grazing nonstop. The willows and aspens along the riverbanks were chewed down to nothing, beaver populations collapsed, and the streams themselves changed shape. In 1995, biologists reintroduced wolves. Within a decade, the willows came back. Beavers returned. Even the rivers ran differently. Bringing one predator back rerouted energy through the whole ecosystem.
"How does removing a top predator change the way energy moves through a food web? Why did bringing the wolves back affect plants, beavers, and even the rivers, not just the elk?"
Texas Drought Kills the Grass
During the 2011 Texas drought, pastures across the state turned brown and brittle. Grasses produce no new growth without water, so the energy supply for everything above them in the food web shrank fast. Ranchers had to sell off cattle they couldn't feed. Deer populations dropped. Hawks and coyotes that hunted small animals in those pastures had less prey. One missing rainfall pattern cascaded all the way up the food web in a single summer.
"When the grass dies, why doesn't the disruption stop with the grass? Trace the energy flow from grass up to a hawk. Which trophic levels are affected first, and which are affected later?"
Sea Otters and Kelp Forests
Sea otters along the Pacific coast eat sea urchins. Sea urchins eat kelp. Kelp forests are home to dozens of fish species and serve as a giant producer base for the whole coastal food web. When sea otters were nearly hunted to extinction in the 1800s, urchin populations exploded and ate the kelp forests down to bare rock. The fish disappeared with the kelp. As otter populations have recovered in protected areas, the urchins are kept in check, the kelp grows back, and the rest of the food web returns with it.
"Why does removing sea otters end up wiping out fish populations they didn't even eat? How does the energy from the sun flow through this ecosystem, and where does it get cut off when otters are gone?"
💡 Free Engagement Ideas for 8.12A
Yarn Food Web Disruption
Give every student a card with one organism on it (sun, grass, grasshopper, mouse, snake, hawk, deer, coyote, decomposer). Stand them in a circle and connect every "eats" relationship with a piece of yarn. Once the web is built, call out a disruption ("Drought hits and the grass dies"). The student holding "grass" sits down. Anyone connected to grass feels the slack. Walk through what happens to each remaining organism's food source.
Energy Pyramid Cup Stack
Give each group 111 small cups labeled as energy units. Stack 100 at the bottom (producers), 10 at the next level (primary consumers), 1 at the top (secondary consumer). Show how the 10 percent rule limits how much can be supported at each level. Then "remove" cups from the bottom (a disruption to producers) and have students rebuild the pyramid to show what happens to the upper levels.
Disruption Card Sort and Predict
Print 12 cards each with a real ecosystem disruption (Yellowstone wolves removed, Texas drought, sea otter hunting, hurricane on the Gulf Coast, deforestation, invasive zebra mussels). Pair each with a blank "predicted outcome" card. Groups read each disruption and write what they think will happen to the food web. Reveal the actual outcomes one at a time and discuss the misses.
Texas Ecosystem Energy Map
Assign each group a Texas ecosystem (Hill Country, Gulf Coast marsh, East Texas piney woods, West Texas desert). They build a basic food web on poster paper, draw arrows to show energy flow from the sun up through producers and consumers, and then add one disruption (a drought, a hurricane, a new highway, an invasive species). They mark which connections in the web are broken or rerouted. Groups present and the class votes on which ecosystem would recover fastest.
🎯 What Approaches, Meets, and Masters Thinking Look Like
Here is what student thinking at each level looks like on this one task, so you know what to look for and how to move a student up.
In a grassland food web, grass feeds both rabbits and grasshoppers. Hawks eat the rabbits, and snakes eat the grasshoppers. A disease wipes out most of the hawks. Explain how this disruption changes the rabbit population and the grass population, and explain why the change happens.
- The grass-rabbit-hawk path in the web shown correctly, with arrows pointing from the organism being eaten toward the one eating it: grass to rabbits to hawks.
- Recognizing this is one path inside a larger web: grass also feeds grasshoppers that snakes eat, even though this question focuses on the rabbits and hawks.
- Grass identified as the producer that captures the sun's energy, with the rabbits and hawks tracing their energy back to it.
- The direct effect named: fewer hawks means fewer predators hunting the rabbits.
- The next step traced: with fewer predators, the rabbit population grows.
- The ripple finished: more rabbits eat more grass, so the grass population goes down.
- A reason for each step, not just a list of what happens. Following who loses a predator and who loses a food source.
- Tracing the change all the way down to the grass, not stopping at the rabbits. That is the easiest place to slip.
If a disease kills most of the hawks, then there are way fewer hawks in the grassland. That is the change. The rabbits and the grass are basically fine because the disease only hit the hawks, not them. The disruption really just affects the hawks since they are the ones that got sick.
The energy starts in the grass from the sun. The rabbits eat the grass and the hawks eat the rabbits. When the disease kills most of the hawks, the rabbits have way fewer predators hunting them, so more rabbits survive and the rabbit population grows. Then all those extra rabbits eat more grass than before, so the grass population goes down. So losing the hawks does not just affect the hawks. It changes the rabbits and the grass too.
The reason the change spreads is that the hawks were the rabbits' predator, and predators keep the level below them in check. Take the hawks away and nothing is holding the rabbit numbers down, so the rabbits climb. More rabbits means more mouths eating grass, and the grass is the producer that everything depends on, so the grass gets overgrazed and drops. The disruption hit the top but the damage rolled all the way to the bottom.
That is the part that surprised me. Removing a top predator can hurt the producer more than the predator ever did. You see the same thing with sea otters in a kelp forest: take away the otters and the sea urchins explode, then mow down the kelp. No one touched the kelp directly, but removing the predator at the top wrecked the producer at the bottom.
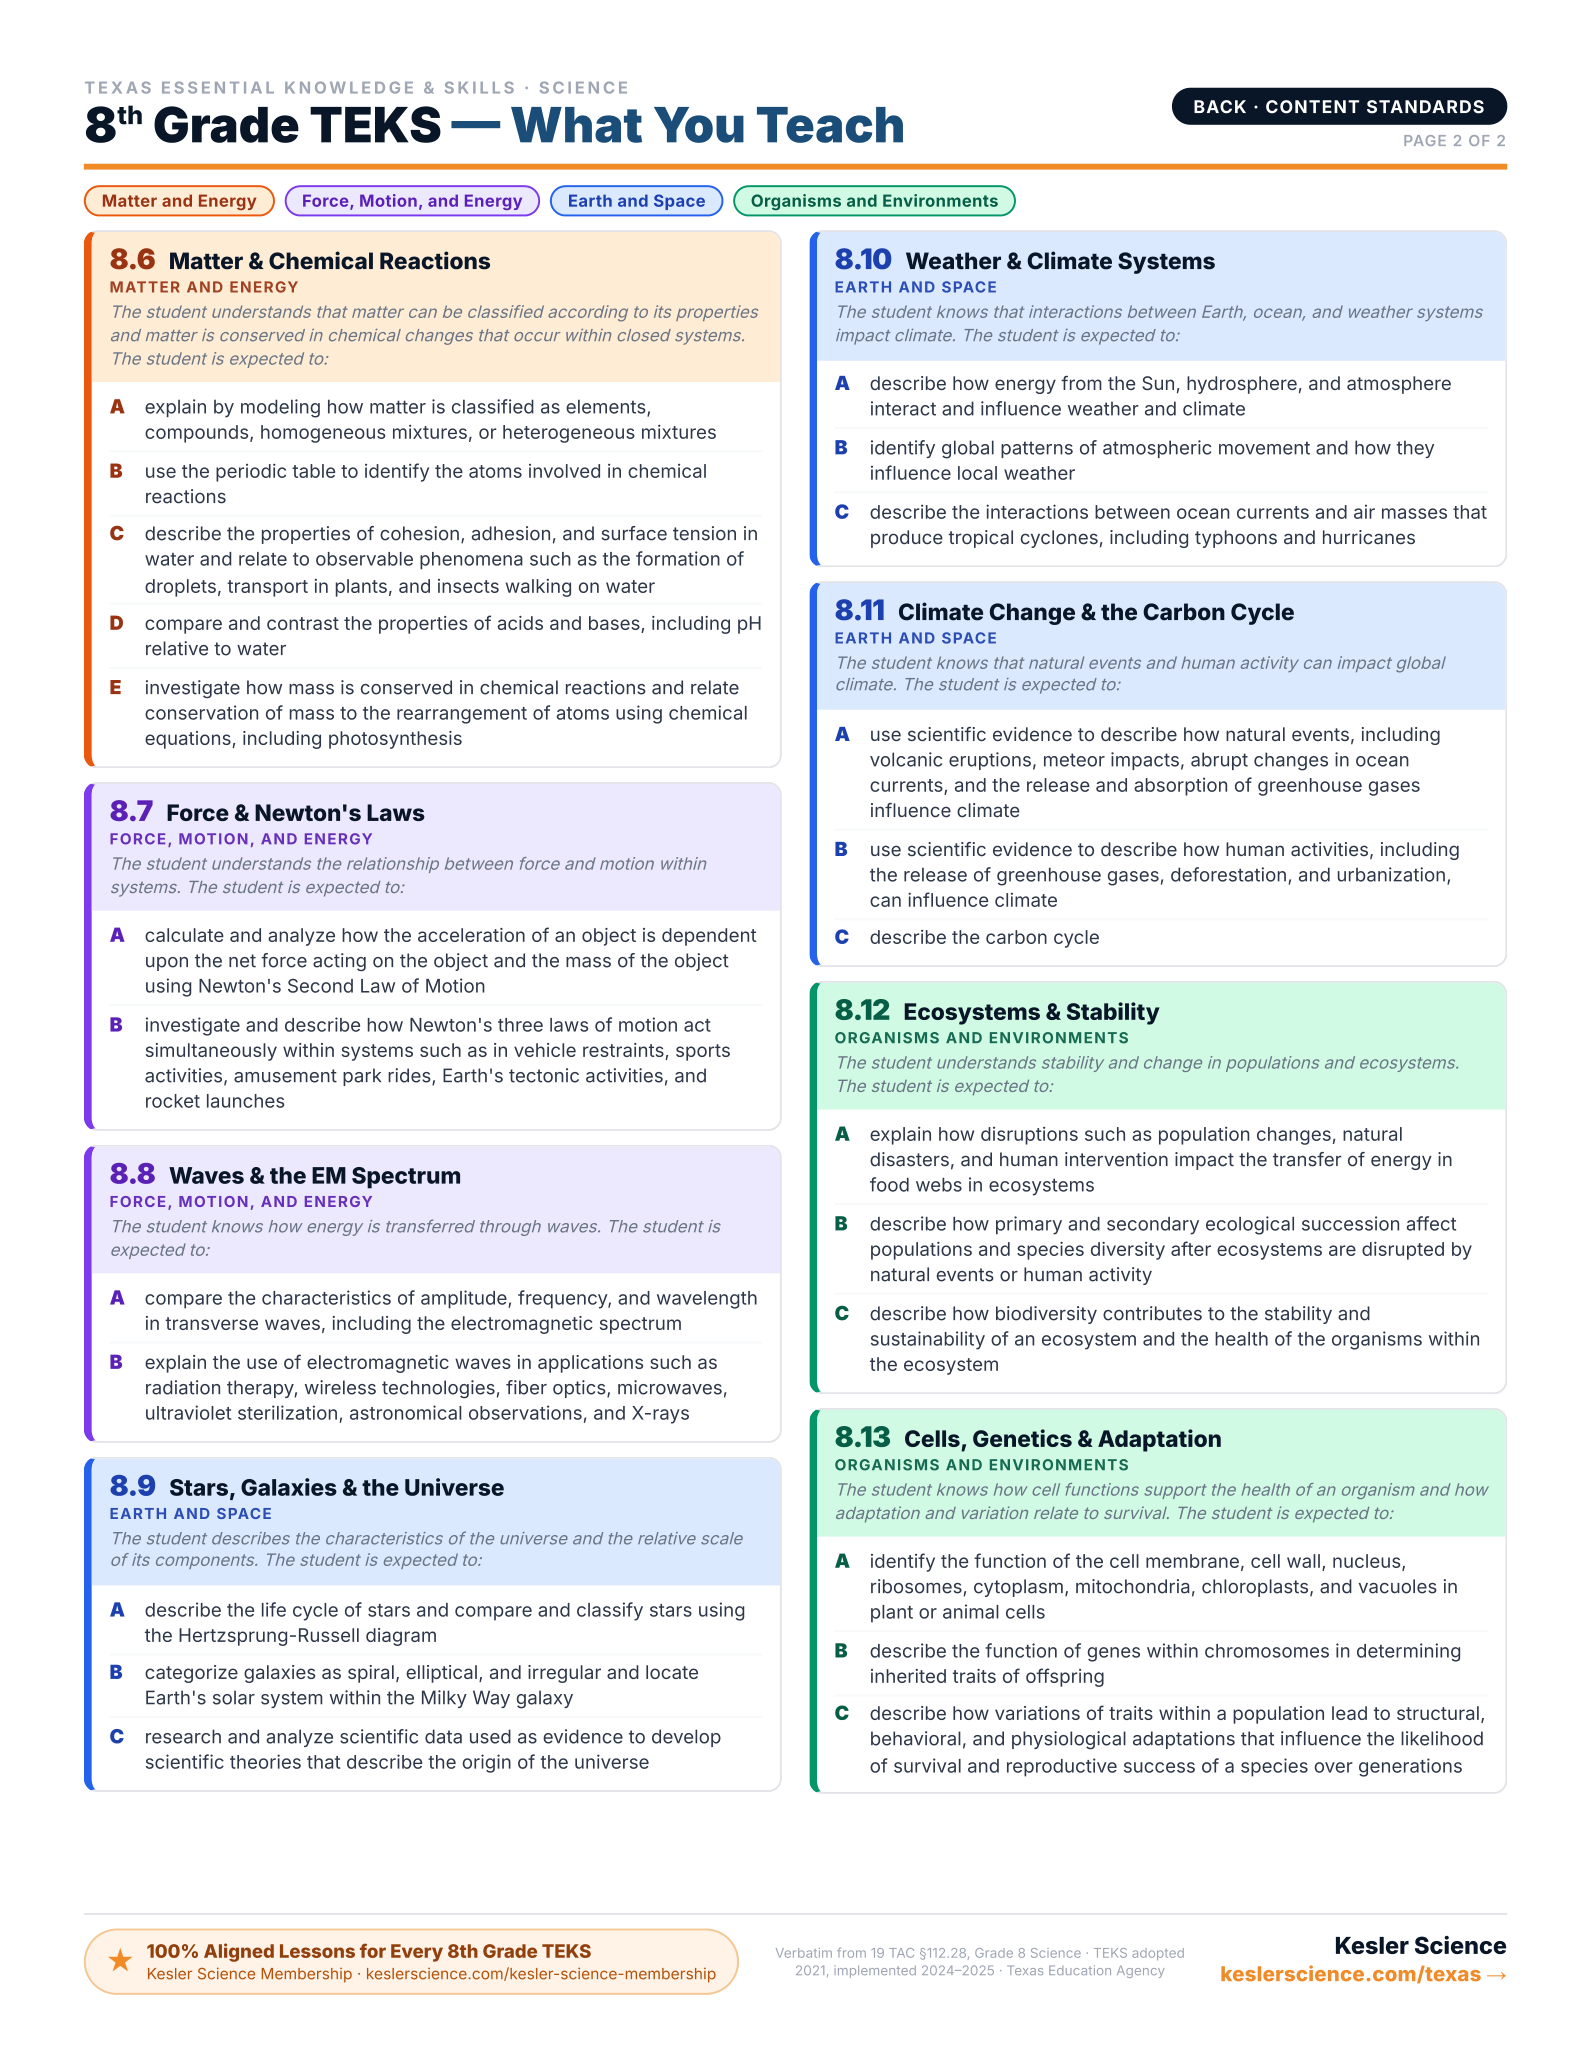
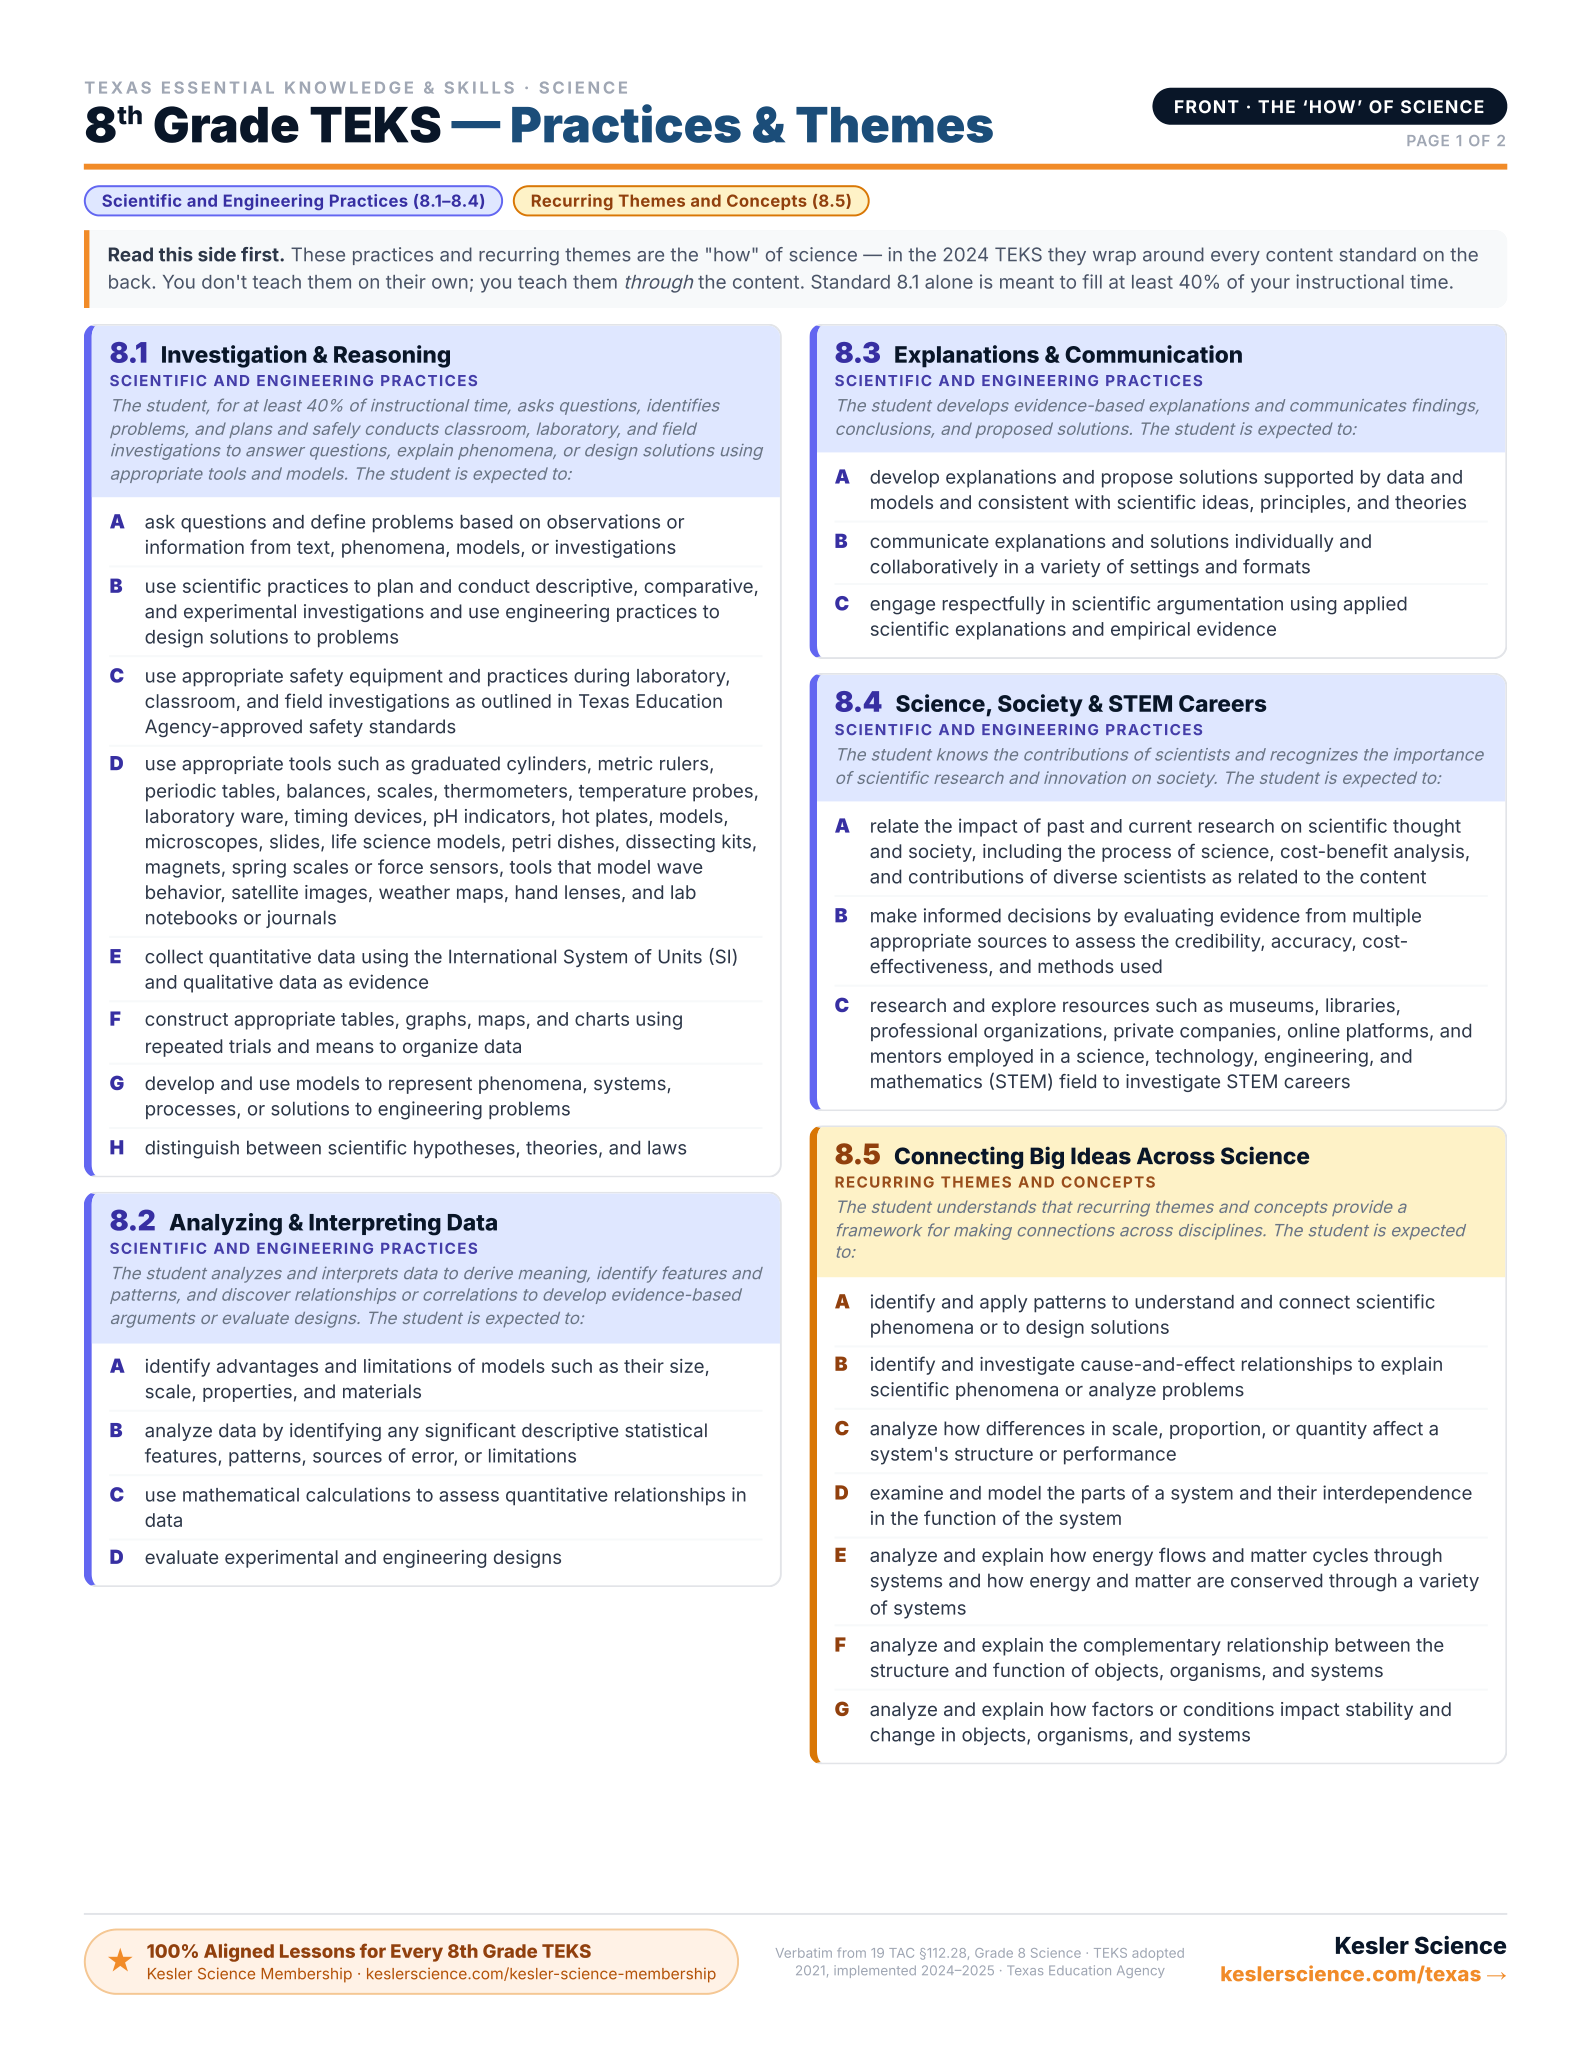
Every 8th-Grade Science TEKS on One Page
The color-coded, front-and-back cheat sheet I wish I'd had — every standard, organized by reporting category. Print it and reference it all year long. This will be your new favorite document!
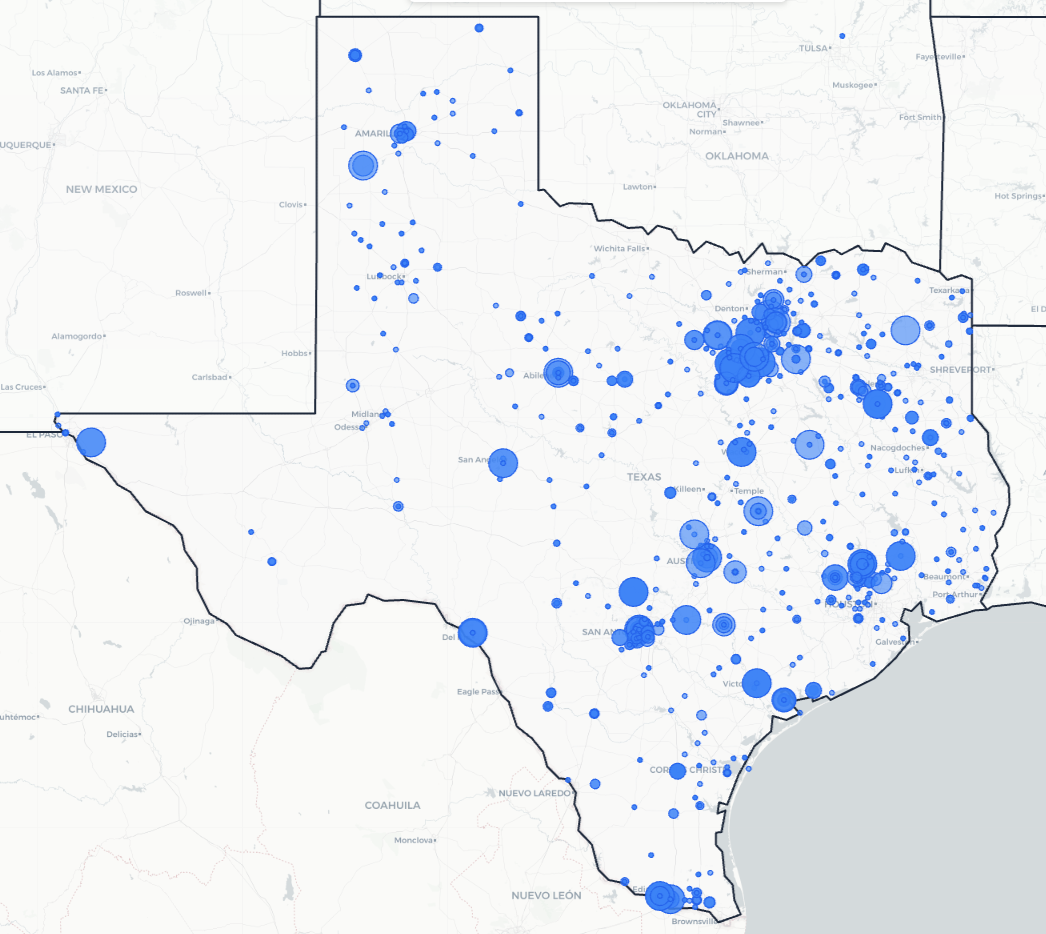
Trusted Across Texas
From the Rio Grande Valley to the Panhandle, Texas science teachers are using Kesler Science to save time and engage students.
Texas Schools and Districts
Love Kesler Science
What Teachers Are Saying
Give Your Science Teachers Everything They Need
School and district licenses give your teachers access to every resource they need, including station labs, inquiry labs, anchoring phenomena, presentations, escape rooms, and much more. One purchase covers the grade levels you need.
- PO-friendly. We accept purchase orders
- Volume discounts for 11+ teachers
- Complimentary Kesler Science Plus orientation for 4+ teachers
- Three free implementation PD sessions for departments of 11+
- Aligned to the 2024 TEKS standards
See It in Action
Book a walkthrough and we'll show you how Kesler Science fits your campus.
Book Demo CallNo pressure, no hard sell