.png?width=375&height=100&name=WebPage%20logo%20with%20curves%202026%20(8).png)
Texas Science Teacher Resource Hub
Free scope and sequences, TEKS breakdowns, phenomenon ideas, and engagement activities for the 2024 Texas science standards.

🚀 Jump to Your Grade
Pick your grade level and go straight to your TEKS standards, aligned resources, and teaching tools.
-
4th
→4th Grade Science20 standards • Matter, Earth, Energy & more
-
5th
→5th Grade Science19 standards • Matter, Ecosystems, Space & more
-
6th
→6th Grade Science24 standards • Forces, Energy, Matter & more
-
7th
→7th Grade Science27 standards • Cells, Chemistry, Earth & more
-
8th
→8th Grade Science24 standards • Newton's Laws, Space, Genetics & more
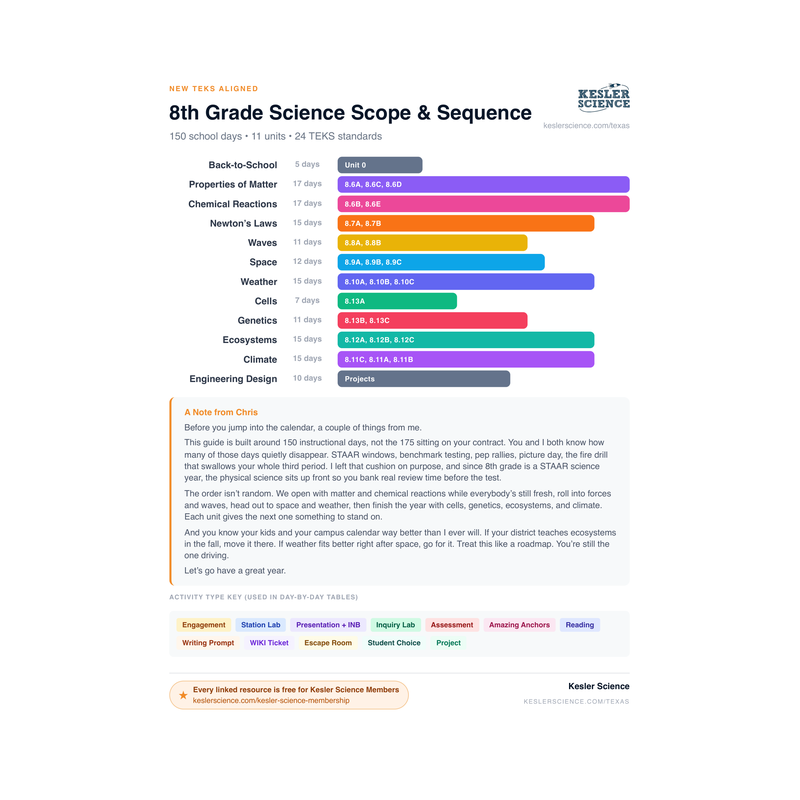
8th Grade TEKS Standards
Click any standard to see what it means, how to teach it, where students get stuck, and aligned resources.
Human Activities & Climate
"Use scientific evidence to describe how human activities, including the release of greenhouse gases, deforestation, and urbanization, can influence climate."
💡 What This Standard Actually Means
"Use scientific evidence to describe". Students aren't memorizing policy positions or arguments. They are reading real scientific data (temperature records, CO2 charts, satellite images of forests and cities) and explaining how human activities are influencing climate. The standard uses "including", which signals where to focus your students: the release of greenhouse gases, deforestation, and urbanization. Students should be able to identify each activity, explain how it affects climate, and point to a piece of evidence that shows the trend. Instruction can take many forms, such as data-analysis tasks, before-and-after satellite images, cause-effect diagrams, and graph-reading exercises.
The release of greenhouse gases adds heat-trapping gases to the atmosphere. When humans burn coal, oil, and natural gas in power plants, cars, and factories, the carbon stored in those fuels combines with oxygen and enters the atmosphere as CO2. Industrial processes, livestock, landfills, and other human activities also release methane and other greenhouse gases. These gases trap infrared energy that Earth's surface tries to re-emit to space, warming the lower atmosphere. Measurements at Mauna Loa Observatory have tracked atmospheric CO2 climbing steadily since 1958, from about 315 parts per million to over 425 parts per million today. That climb is the evidence.
Deforestation reduces Earth's ability to pull CO2 back out of the air. Trees and other plants take in CO2 during photosynthesis and store the carbon in their trunks, leaves, and soil. When forests are cleared and burned, two things happen at once: the stored carbon goes back into the atmosphere as CO2, and the planet loses some of the "sinks" that would have absorbed future emissions. Satellite images from agencies like NASA and NOAA show large losses of forest cover in places like the Amazon and Southeast Asia over the last several decades.
Urbanization changes how Earth's surface absorbs and releases heat. When forests, fields, and wetlands are replaced by asphalt, concrete, and buildings, the surface gets darker (lower albedo) and absorbs more sunlight. Cities also generate waste heat from cars, air conditioners, and industry. The result is the urban heat island effect, where city centers can run noticeably warmer than nearby rural areas, especially at night. Replacing natural land with paved land also reduces local CO2 absorption and changes local water cycles. Globally, the temperature record shows about 1.1 degrees Celsius of warming since the late 1800s, and the international scientific consensus, summarized by the IPCC, is that recent warming is primarily driven by human activity.
This is the standard I used to dread teaching. I worried about stepping on toes and ending up in a conversation that was not about science anymore. What changed for me was shifting the whole lesson toward data. I would put up the Keeling Curve of CO2 at Mauna Loa and the NASA global temperature graph and let students read them. What's the y-axis? What's the x-axis? What's the trend? What do the data show? It is much harder to argue with your own observations than with a teacher's talking points. Stay with what the measurements show, stay with the mechanism of how greenhouse gases trap heat, and you will teach a strong, honest lesson without ever having to take a political position.
⚠️ Misconceptions Your Students May Have
These are some of the most common misconceptions. Knowing what to look for can help you get ahead of them.
"Climate change is the same thing as the ozone hole"
These are two different environmental issues. The ozone layer is a region of the stratosphere that blocks ultraviolet radiation. It was damaged by chlorofluorocarbons (CFCs), which were largely phased out by the Montreal Protocol. Climate change is caused by greenhouse gases like CO2 and methane trapping infrared heat in the lower atmosphere. Students often conflate them, but they have separate causes, mechanisms, and solutions.
"CO2 is the only greenhouse gas that matters"
CO2 is the largest contributor to human-caused warming by volume, but it is not the only one. Methane, nitrous oxide, and water vapor are all greenhouse gases. Methane traps more heat per molecule than CO2 but stays in the atmosphere for a shorter time. Students should know CO2 is the biggest player, but other gases from agriculture and waste also matter.
"If it was cold yesterday, climate change isn't real"
Weather is short-term, climate is long-term. A cold week in Texas or a snowstorm anywhere says nothing about the long-term trend of global average temperature. Climate scientists look at data averaged over decades across the whole planet. Individual weather events are noise; the trend line across many years is the signal.
"Scientists disagree about whether humans are causing warming"
There is strong scientific consensus, summarized by the Intergovernmental Panel on Climate Change (IPCC), that recent warming is primarily caused by human greenhouse gas emissions. Individual scientists debate specific predictions, timelines, and mechanisms, but the core finding is well established in peer-reviewed literature from NASA, NOAA, and international climate agencies.
📓 Teaching Resources for 8.11B
These resources are aligned to this standard.


100% Aligned Lessons for Every TEKS You Teach
Kesler Science Plus puts thousands of ready-to-teach lessons and activities in your hands, so you can boost engagement and get your planning time back. Trusted by schools and districts all over the great state of Texas.
🌎 Phenomenon Ideas for 8.11B
Use these real-world phenomena to anchor your lesson. Show students the phenomenon first, let them wonder, then build toward Human Activities & Climate as the explanation.
The Keeling Curve
Since 1958, scientists at Mauna Loa Observatory in Hawaii have measured the amount of CO2 in the air every single day. When the data is graphed, it shows a steady climb from about 315 parts per million in 1958 to over 425 parts per million today, with a small wiggle every year as plants in the Northern Hemisphere bloom in spring and die back in fall. That long, climbing curve is one of the most studied graphs in modern science.
"What human activities started ramping up around 1958 that could be responsible for the rise in atmospheric CO2? Why does the curve also wiggle up and down within each year, and what does that tell us about how plants interact with CO2?"
Satellite Pictures of the Amazon, 1985 vs. Today
Satellites have been photographing the Amazon rainforest from space for decades. When you line up images of the same region from 1985 and today, large patches of green forest have been replaced by tan and brown patches of cleared land, with roads cutting straight lines through what used to be unbroken canopy. Scientists estimate the Amazon has lost roughly 17 to 20 percent of its original forest cover, depending on how loss is measured.
"Forests pull CO2 out of the atmosphere during photosynthesis. What happens to that absorbed carbon when forests are cut and burned? How might losing 20% of the Amazon's tree cover change how much CO2 stays in the air worldwide?"
Cities Run Hotter Than the Countryside Around Them
On a summer night, a thermometer in downtown Houston might read 88 degrees Fahrenheit while a thermometer in a rural area 30 miles outside the city reads 78 degrees. The two places have the same weather pattern, the same time of year, and the same latitude. What's different is the surface. Asphalt, concrete, and buildings absorb solar energy during the day and release it slowly at night, while grass and trees cool down faster. Scientists call this the urban heat island effect.
"Why might a paved city stay warmer overnight than a field of grass at the same latitude? As more land is converted into pavement and buildings, how would that change local climate over time?"
💡 Free Engagement Ideas for 8.11B
Reading the Keeling Curve
Print a clean copy of the Keeling Curve (CO2 at Mauna Loa from 1958 to today). Have students label the axes, identify the starting and ending CO2 values, calculate the total increase in parts per million, and circle one of the small annual wiggles. Then give them a blank year on the curve and ask them to predict the CO2 value based on the trend. The math forces them to use the data, not just glance at it.
Greenhouse Effect in a Jar
Fill two clear glass jars with room-temperature water and put a thermometer in each. Cover one jar tightly with plastic wrap. Leave the other open. Place both under a desk lamp for 15 minutes and record temperature every 2 minutes. The covered jar warms faster because the plastic wrap, like greenhouse gases, traps the infrared energy escaping the water. Tie the activity directly to how added CO2 traps more heat in Earth's atmosphere.
Deforestation Before-and-After Map
Pull free satellite images of a region (the Amazon, Borneo, or parts of Texas) from NASA Earth Observatory or Global Forest Watch, one from the 1980s and one from today. Print them at the same scale. Students estimate the percentage of forest cover lost by overlaying a transparent grid and counting squares. Then they calculate roughly how much CO2 absorption capacity has been lost based on a per-acre estimate.
Urban Heat Island Surface Test
Put four samples on the school sidewalk on a sunny day: a piece of black asphalt scrap, a square of concrete, a patch of grass or sod, and a square of soil. Place an infrared thermometer (or a regular thermometer with each surface) and measure the temperature every five minutes for half an hour. Have students graph the results and compare the surfaces. Discuss how replacing the grass and soil with asphalt and concrete in cities raises local temperatures.
🎯 What Approaches, Meets, and Masters Thinking Look Like
Here is what student thinking at each level looks like on this one task, so you know what to look for and how to move a student up.
Burning fossil fuels for energy releases carbon dioxide (CO2) into the atmosphere. Explain how this human activity changes Earth's climate, and describe the mechanism that connects the carbon dioxide to a warming planet.
- A clear statement that burning fossil fuels adds CO2 to the atmosphere.
- CO2 identified as a greenhouse gas, not just "pollution" or "dirty air."
- The mechanism: Earth's surface gives off heat (infrared energy) toward space, and CO2 traps some of that outgoing heat instead of letting it escape.
- The result tied back to climate: more CO2 means more trapped heat, so the lower atmosphere warms over time.
- Climate (a long-term trend) kept separate from a single day's weather.
- Climate change kept separate from the ozone hole. They share the word "atmosphere" but have different gases, causes, and mechanisms, and that is the easiest place to slip.
Burning fossil fuels puts a lot of pollution and CO2 into the air. All of that pollution makes a hole in the ozone layer, and the hole lets in extra heat from the sun, so the planet gets hotter. That is why the climate is warming up.
When we burn coal, oil, and gas for energy, the carbon in those fuels combines with oxygen and goes into the air as CO2. CO2 is a greenhouse gas. Sunlight warms Earth's surface, and the surface gives that heat back off as infrared energy that is supposed to go out to space. CO2 traps some of that outgoing heat instead of letting it escape, kind of like a blanket. So as we add more CO2 by burning fuels, more heat gets trapped and the lower atmosphere slowly warms up over many years. That is how this activity changes the climate.
Burning fossil fuels releases CO2, a greenhouse gas. Earth's surface absorbs sunlight and re-emits that energy as infrared heat headed for space. CO2 absorbs some of that outgoing infrared and sends part of it back toward the surface, so less heat escapes and the lower atmosphere warms. The more CO2 we add, the stronger that trapping gets, which shifts the long-term climate warmer.
The real idea is that the warming comes from adding heat-trapping gas to the atmosphere, not from the gas itself being "dirty." That is why deforestation does damage too, even though no fuel is being burned for energy. Trees pull CO2 out of the air and store the carbon, so cutting and burning a forest both releases that stored carbon and removes a sink that would have absorbed future CO2. The activity is different, but the mechanism is the same: more CO2 staying in the atmosphere means more trapped heat and a warmer climate.
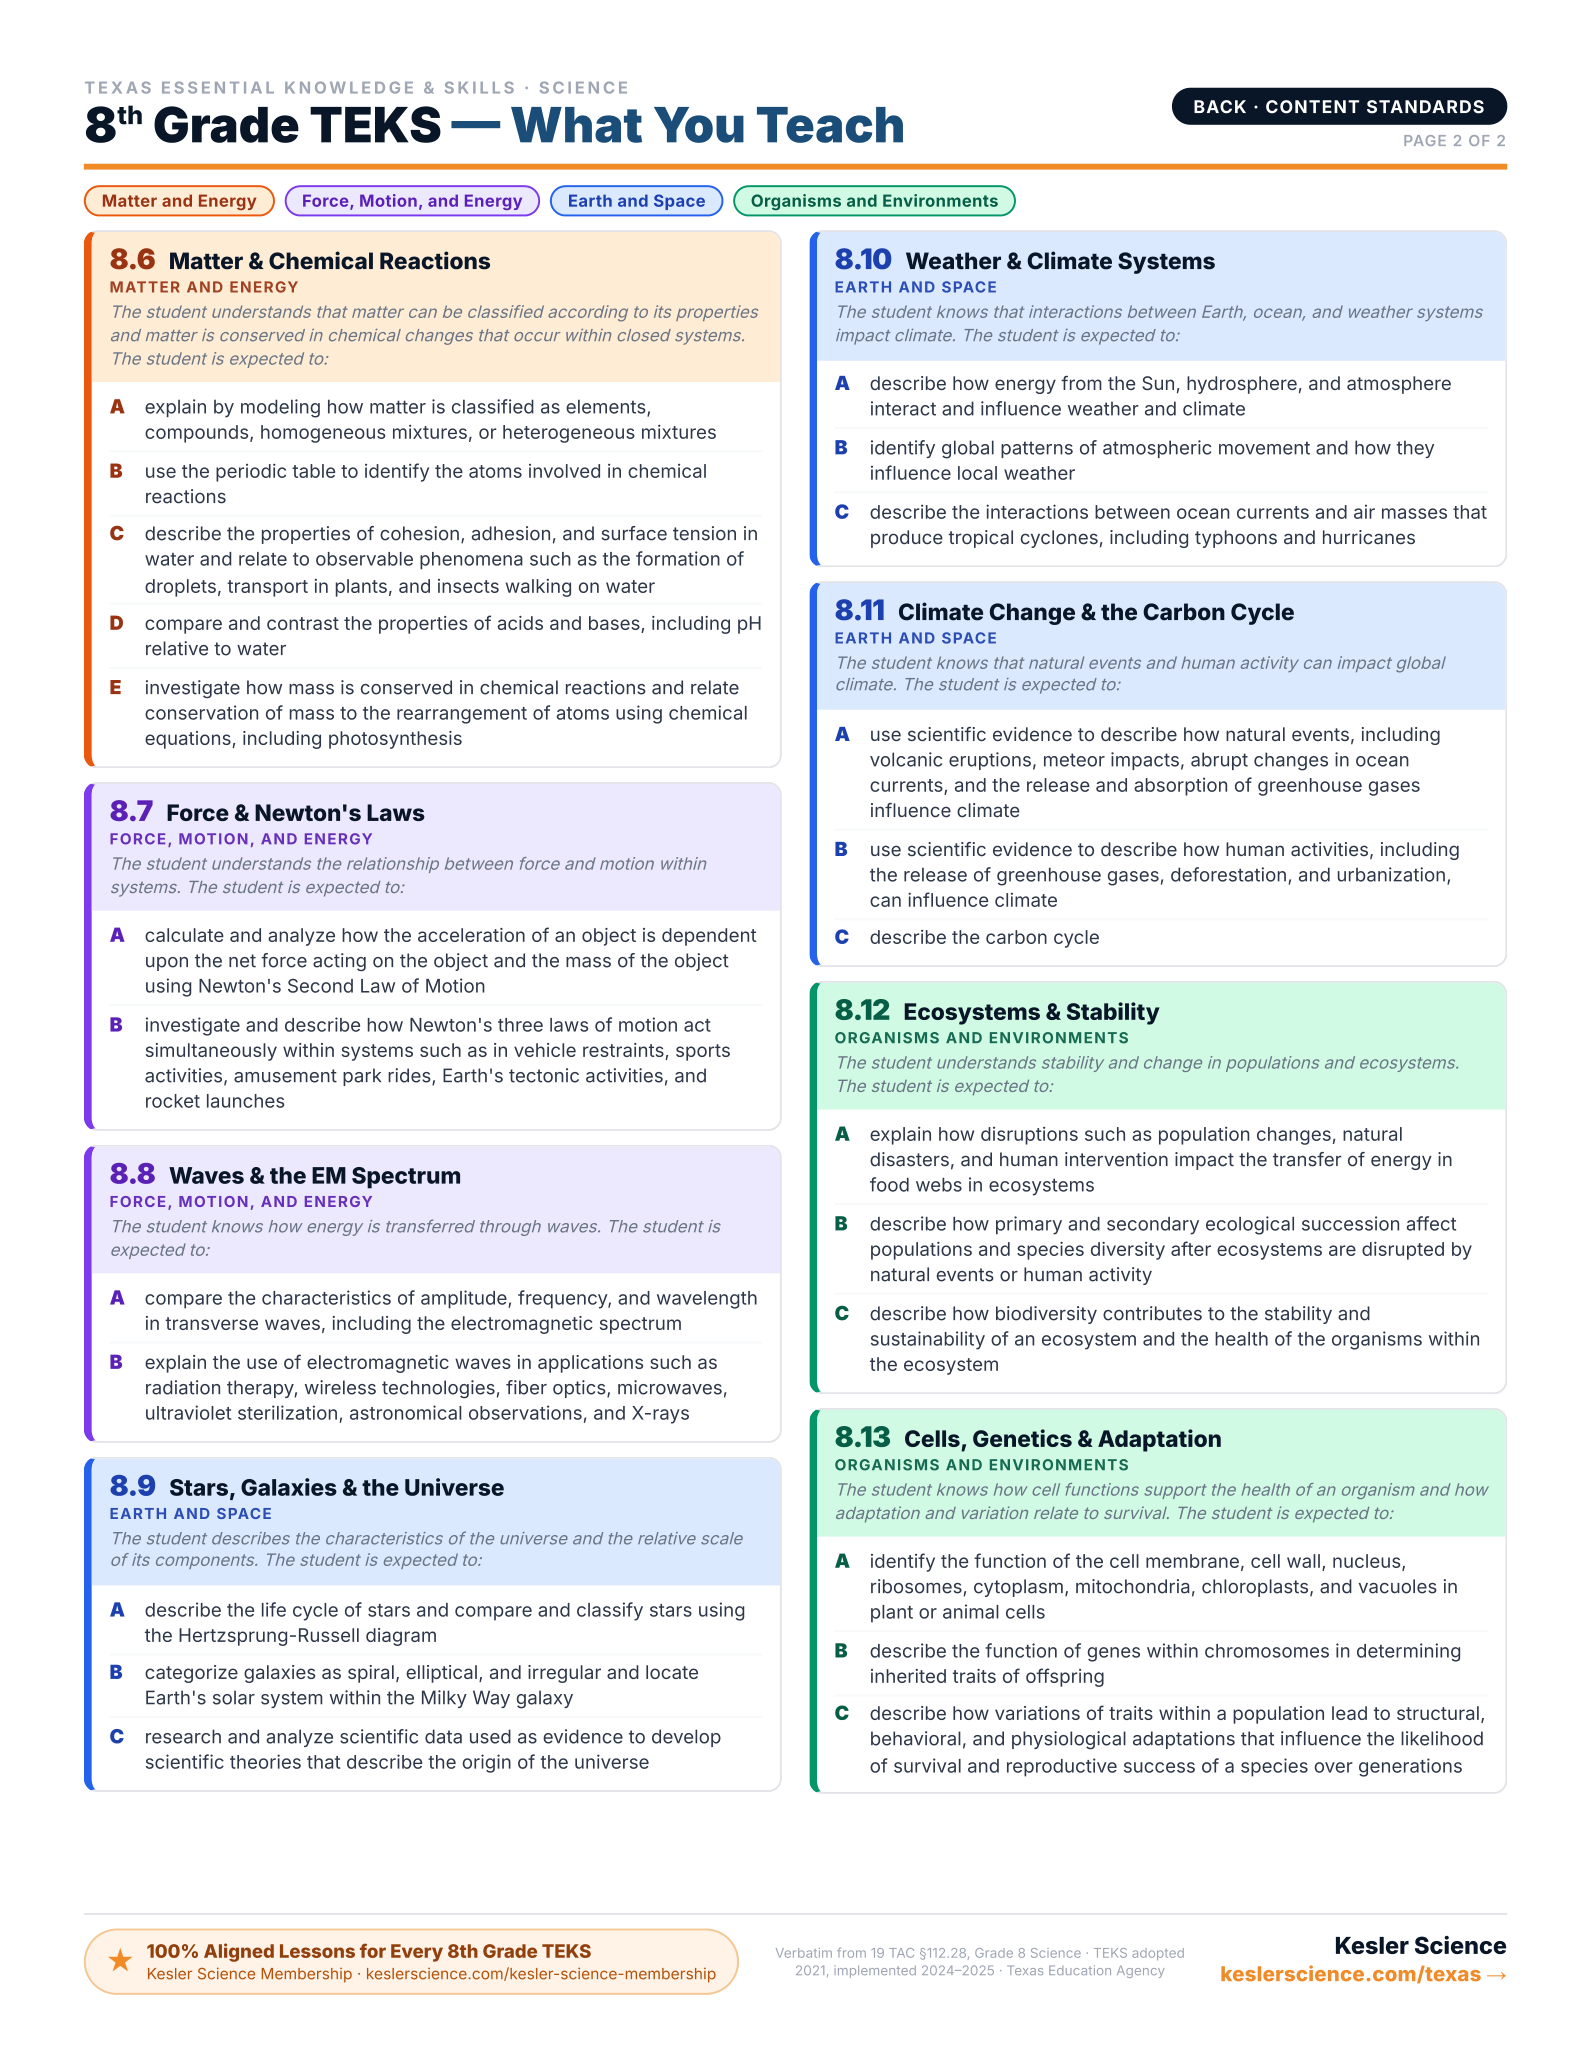
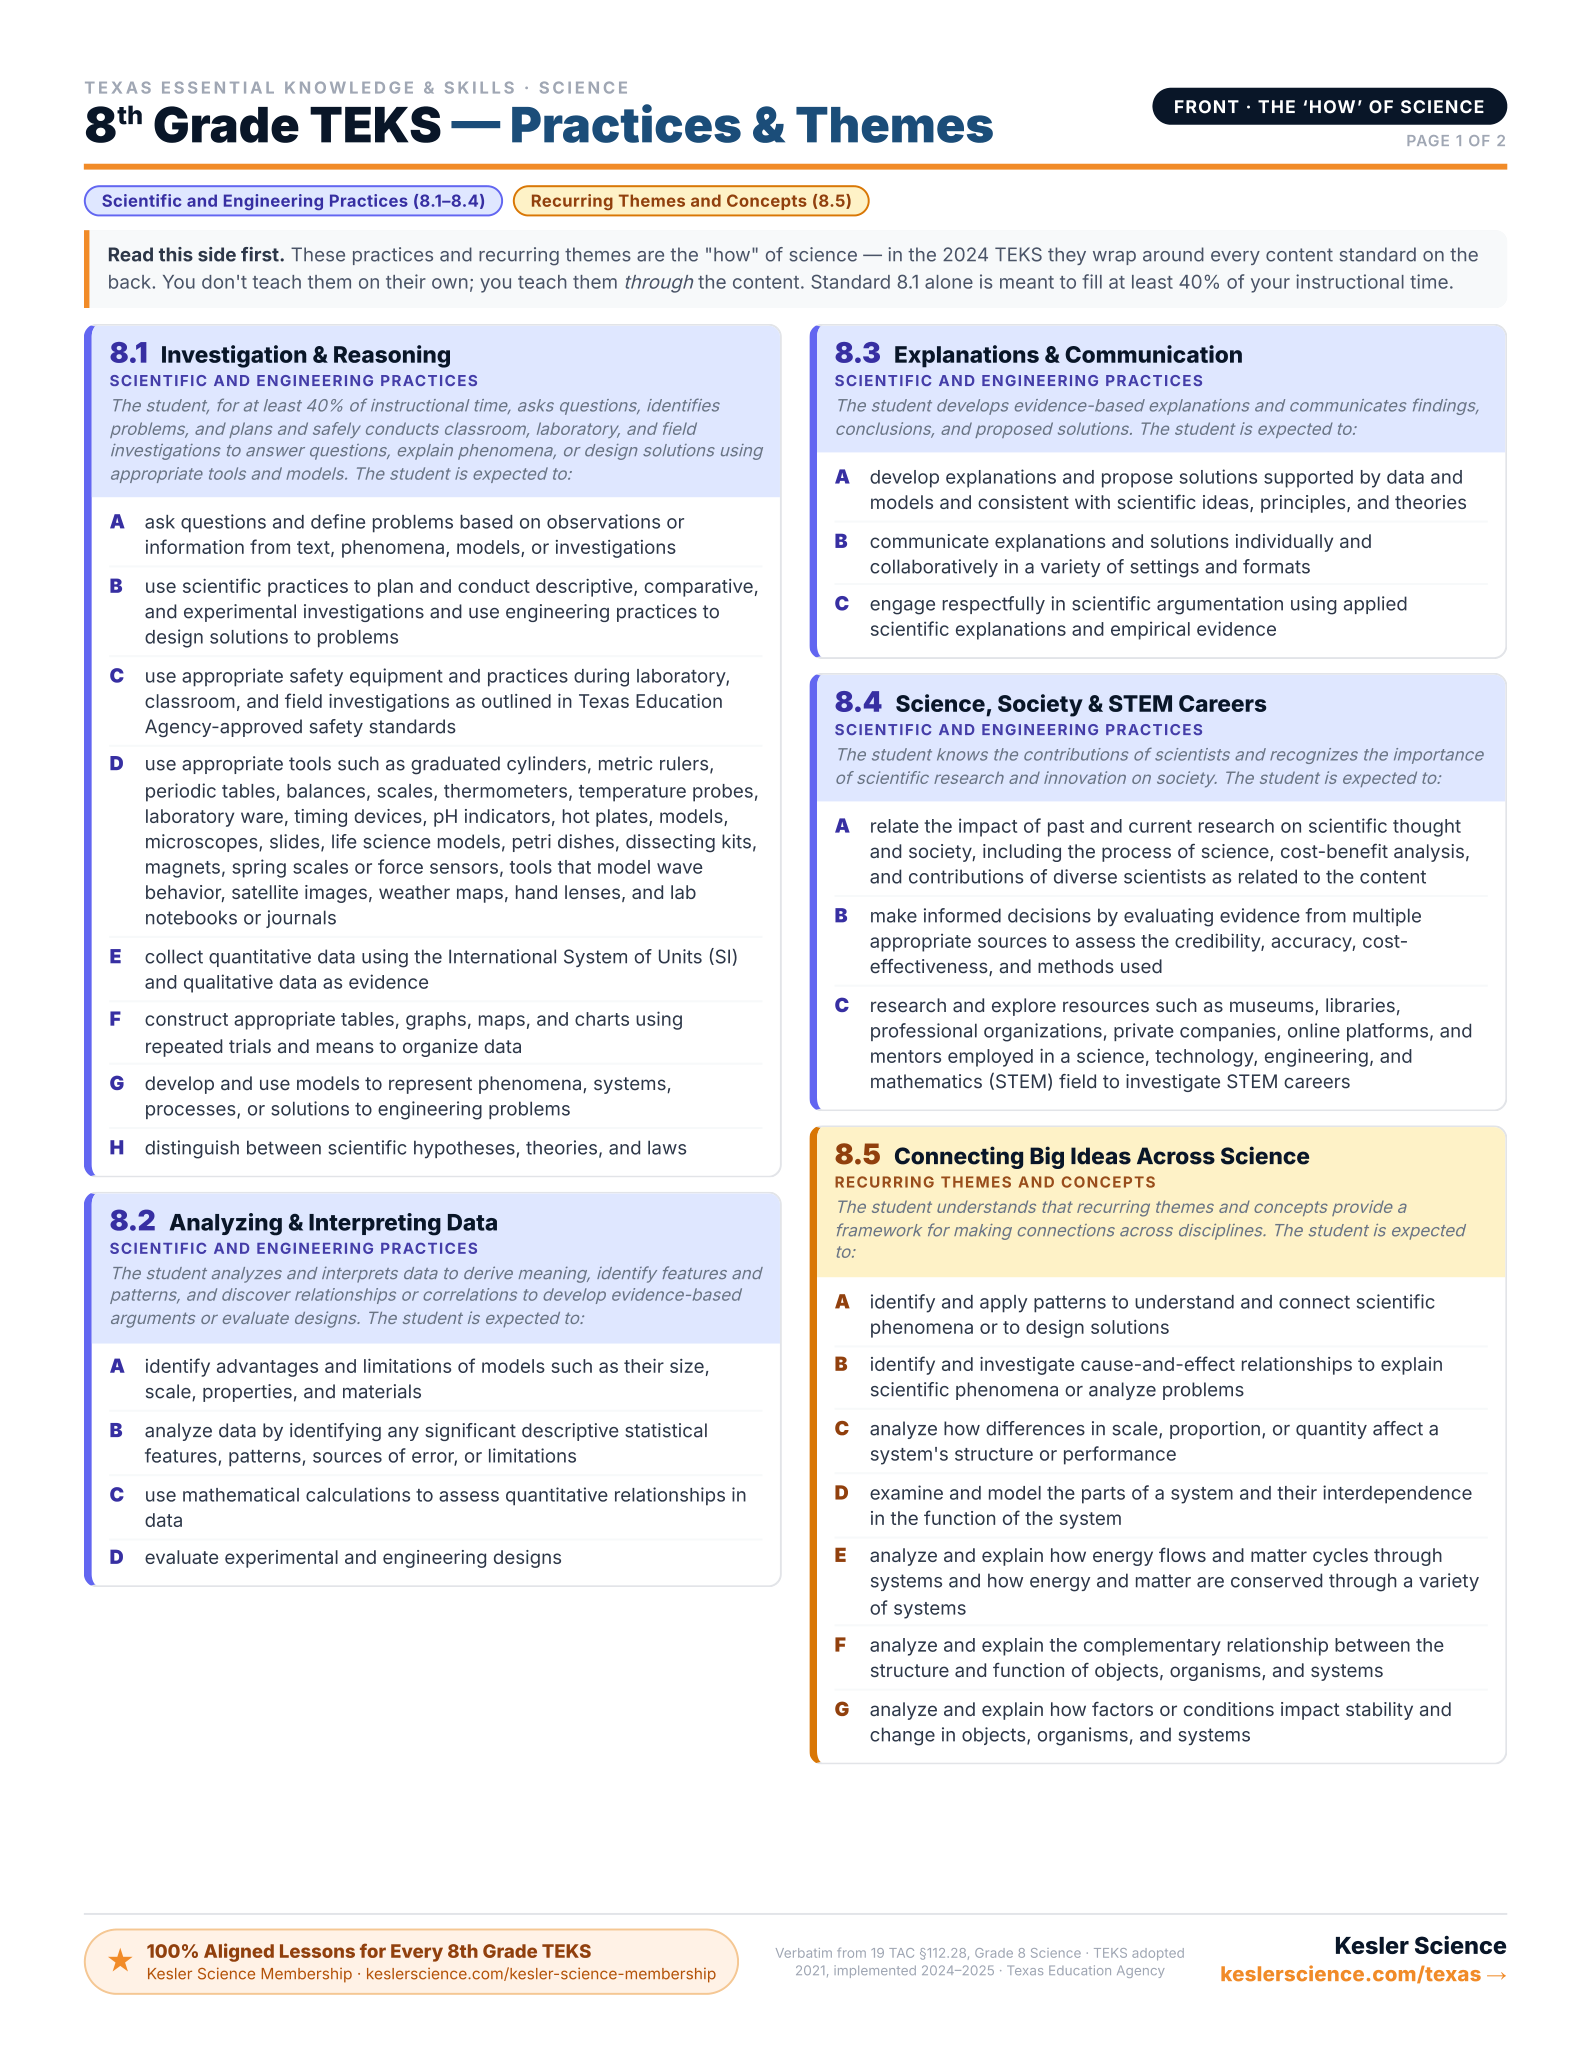
Every 8th-Grade Science TEKS on One Page
The color-coded, front-and-back cheat sheet I wish I'd had — every standard, organized by reporting category. Print it and reference it all year long. This will be your new favorite document!
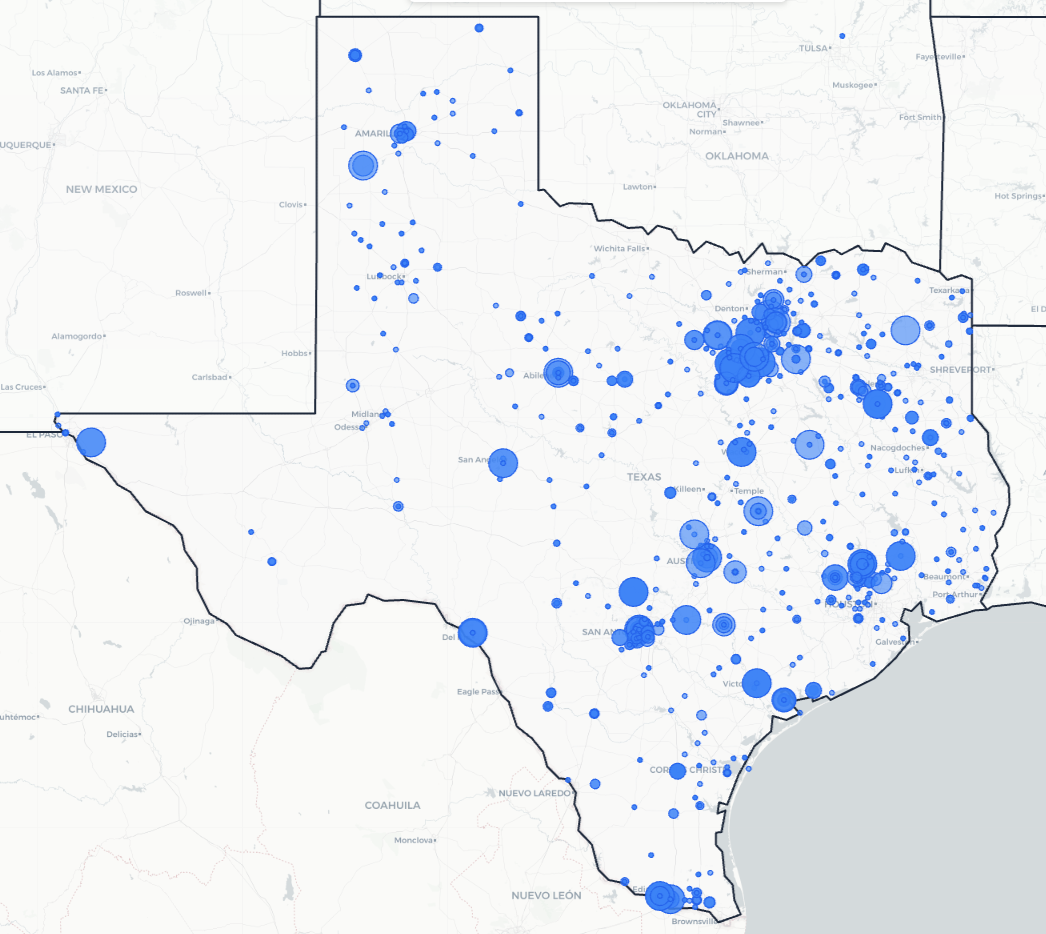
Trusted Across Texas
From the Rio Grande Valley to the Panhandle, Texas science teachers are using Kesler Science to save time and engage students.
Texas Schools and Districts
Love Kesler Science
What Teachers Are Saying
Give Your Science Teachers Everything They Need
School and district licenses give your teachers access to every resource they need, including station labs, inquiry labs, anchoring phenomena, presentations, escape rooms, and much more. One purchase covers the grade levels you need.
- PO-friendly. We accept purchase orders
- Volume discounts for 11+ teachers
- Complimentary Kesler Science Plus orientation for 4+ teachers
- Three free implementation PD sessions for departments of 11+
- Aligned to the 2024 TEKS standards
See It in Action
Book a walkthrough and we'll show you how Kesler Science fits your campus.
Book Demo CallNo pressure, no hard sell