.png?width=375&height=100&name=WebPage%20logo%20with%20curves%202026%20(8).png)
Texas Science Teacher Resource Hub
Free scope and sequences, TEKS breakdowns, phenomenon ideas, and engagement activities for the 2024 Texas science standards.

🚀 Jump to Your Grade
Pick your grade level and go straight to your TEKS standards, aligned resources, and teaching tools.
-
4th
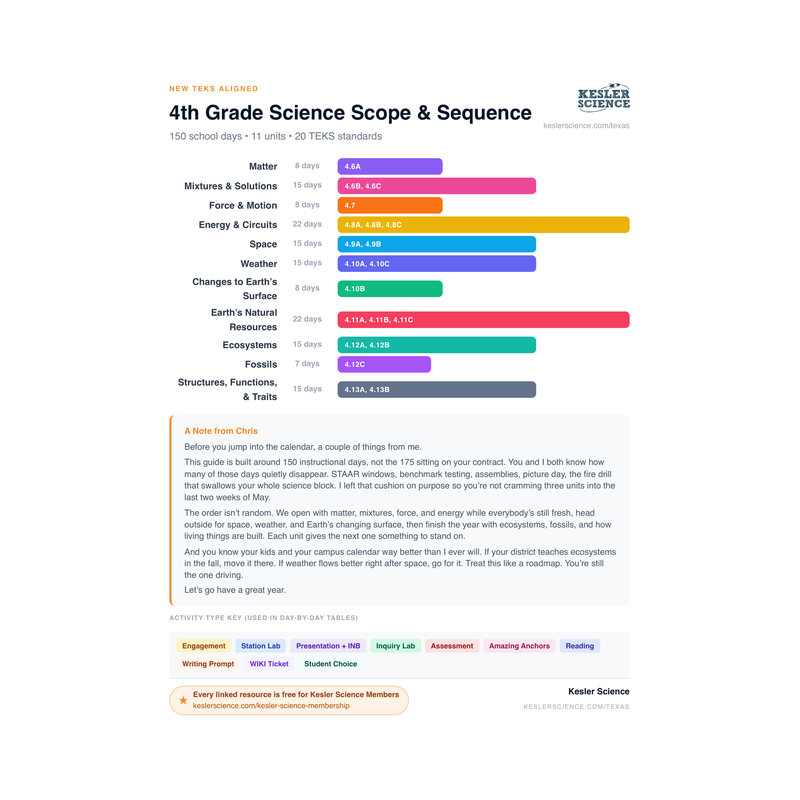
→4th Grade Science20 standards • Matter, Earth, Energy & more
-
5th
→5th Grade Science19 standards • Matter, Ecosystems, Space & more
-
6th
→6th Grade Science24 standards • Forces, Energy, Matter & more
-
7th
→7th Grade Science27 standards • Cells, Chemistry, Earth & more
-
8th
→8th Grade Science24 standards • Newton's Laws, Space, Genetics & more
4th Grade TEKS Standards
Click any standard to see what it means, how to teach it, where students get stuck, and aligned resources.
Patterns of the Seasons
"Collect and analyze data to identify sequences and predict patterns of change in seasons such as change in temperature and length of daylight; and"
💡 What This Standard Actually Means
"Collect and analyze data". Fourth graders aren't just told that seasons change. They're collecting actual numbers and looking for the pattern. The TEKS calls out two specific kinds of seasonal change to track: change in temperature and length of daylight. Both follow predictable yearly cycles. Winter has cold temperatures and short days. Summer has warm temperatures and long days. Spring and fall sit in between, with steady changes from one season to the next. The "predict patterns" part means once kids see the pattern, they can use it to guess what comes next.
Seasons are something every kid lives through, but they don't usually stop to look at the pattern. 4.9A is the standard that turns the everyday experience of "it gets hot in summer" into actual data analysis. The TEKS asks kids to collect and analyze data on two specific things: how the temperature changes through the year, and how the length of daylight changes through the year.
The pattern is predictable. Winter in Texas means cold mornings, sometimes freezing temperatures, and the sun sets before kids finish their afternoon snack. Spring warms up, days get noticeably longer, and the sun is up for more hours. Summer is hot, and the sun sets so late that some kids are still playing outside at 9 p.m. Fall cools off again and the days get shorter. Then it loops back to winter and the cycle starts over. That's the sequence the TEKS wants kids to identify.
By the end of this unit, kids should be able to look at a temperature graph or a daylight chart and predict what next month or next season will look like. They should know that summer days are the longest and winter days are the shortest. They should know that the changes are gradual, not sudden. And they should be using actual numbers (high temperatures, sunset times) instead of just saying "summer is hot." The standard explicitly asks for data, not just descriptions.
The version of this lesson I'd lean on hardest is a year-long temperature and daylight tracking project. Every Friday, two student volunteers walk outside, read the thermometer, and look up the day's sunset time on a phone. Log it on a giant chart on the wall. By December, the chart shows the temperatures crashing and the sunset times pulling earlier. By April, kids start predicting next week's numbers before they even check. By May, they can look at the graph and tell you the summer is going to keep heating up. That's the pattern recognition the standard is asking for. If you don't have a year, just use one or two months of real data plus a printed long-term graph from the National Weather Service. The point is they have to look at numbers, not just memorize "winter cold, summer hot." Predicting patterns is the whole verb.
⚠️ Misconceptions Your Students May Have
These are some of the most common misconceptions. Knowing what to look for can help you get ahead of them.
"It's hot in summer because Earth is closer to the Sun"
Earth's distance from the Sun barely changes through the year. The real reason for the seasons is that Earth is tilted on its axis by about 23.5 degrees. That tilt is why summer is hotter where you live: the Sun gets higher in the sky, the sunlight hits more directly, and the days are longer. In summer, the Sun is high in the sky and the days are long, so the ground heats up. In winter, the Sun stays low and the days are short, so the ground stays cooler.
"Every day in summer has 12 hours of sunlight, and every day in winter has 12 hours of darkness"
The number of daylight hours changes a lot during the year. In Texas in late June, the Sun can be up for over 14 hours. In late December, it's only up for about 10 hours. The two are only equal twice a year, in March and September. Looking up your local sunrise and sunset times for different months proves it.
"Seasons happen at the same time everywhere on Earth"
When it's winter in Texas, it's summer in Australia. The two halves of Earth (Northern Hemisphere and Southern Hemisphere) trade seasons. Christmas in Texas is cold. Christmas in Australia happens in the middle of their summer. The seasonal pattern is real, but it flips depending on which half of Earth you're on.
"Seasons change suddenly on the first day of each season"
The change is gradual. Temperatures and daylight shift a tiny bit each day. By the time it "officially" becomes winter on December 21, it's already been getting colder and the days have already been getting shorter for months. The calendar just gives a name to a pattern that's been changing slowly the whole time.
📓 Teaching Resources for 4.9A
These resources are aligned to this standard.


100% Aligned Lessons for Every TEKS You Teach
Kesler Science Plus puts thousands of ready-to-teach lessons and activities in your hands, so you can boost engagement and get your planning time back. Trusted by schools and districts all over the great state of Texas.
🌎 Phenomenon Ideas for 4.9A
Use these real-world phenomena to anchor your lesson. Show students the phenomenon first, let them wonder, then build toward Patterns of the Seasons as the explanation.
The Sunset Time Mystery
Pull up a calendar app and look up the sunset time for today. Then look up the sunset time for the same date in June. Then again for December. The numbers are very different. In Texas, June 21 the sun sets near 8:35 p.m. December 21 it sets near 5:25 p.m. That's three hours of daylight gone, on the same calendar day six months apart.
"Why does the sun set so much earlier in winter than in summer? What pattern do you think we'd see if we tracked sunset times every month for a whole year?"
The Wardrobe Test
Hold up four photos: a kid in a heavy winter coat, a kid in a light jacket, a kid in shorts and a t-shirt, a kid in a sweatshirt. Don't tell the class anything else. Ask them to put the photos in order from the coldest day to the warmest. Then label each one with a season. Then look up real average temperatures for each Texas season and put numbers on the chart.
"How did you know which photo went with which season? What does this tell you about the pattern of temperature change through the year?"
The Year in a Bar Graph
Project a bar graph of average monthly temperatures for your Texas city, January through December. The bars start short, get taller through spring, peak in summer, then drop back down through fall and winter. The shape looks like a hill. Cover up the December bar and ask the kids to predict how tall it should be. Most of them get it right because they can see the pattern.
"How did you know how tall the December bar should be? What does the shape of this graph tell you about the pattern of seasons?"
💡 Free Engagement Ideas for 4.9A
Year-Long Sunset Tracker
Print a calendar grid for the school year. Every Friday, kids look up the sunset time for that day on a phone or weather app and write it in the box. Once a month, they graph the times on a line graph. By December, the graph shows daylight hours dropping. By May, they can clearly see the pattern climbing back up. Best long-term project for showing 4.9A in action.
Texas Season Temperature Lab
Hand each pair of students a chart of average monthly temperatures for a Texas city (Houston, Austin, Dallas, El Paso). They make a bar graph of the 12 months, label the four seasons, calculate the difference between the hottest month and the coldest month, and write a one-paragraph "pattern report" describing what they see. Real data, real graphing, real analysis.
Sequence the Seasons Cards
Each table gets a stack of 12 picture cards (one for each month) showing weather, plant growth, and clothing for that month. Kids work together to put all 12 cards in order starting with January. Then they label each set of three months with the right season. Quick warm-up that hits the "identify sequences" verb.
Predict the Next Month
Show kids a graph of the first six months of monthly temperatures and daylight for your city (January through June). Then hide July through December. Each kid uses the pattern to predict what July, August, and September will look like, and explain their reasoning in writing. Reveal the actual data and compare. Some kids will be surprisingly close. The "predict patterns" verb gets practiced for real.
🎯 What Approaches, Meets, and Masters Thinking Look Like
Here is what student thinking at each level looks like on this one task, so you know what to look for and how to move a student up.
A class wrote down how many hours of daylight their town had on the same day each month. Here is their data: January had 10 hours, March had 12 hours, June had 14 hours, and September had 12 hours. Look at the numbers and describe the pattern of daylight through the year. Then predict: about how many hours of daylight do you think December will have, and why?
- Uses the actual numbers from the data, not just words like "summer is long."
- Notices that daylight goes up from January to June, then back down after June.
- Connects the longest daylight (June, 14 hours) to summer and the shortest (January, 10 hours) to winter.
- Sees that the change is gradual, a little each month, not a sudden jump.
- Makes a prediction for December that is close to the short, winter end (around 10 hours).
- Explains the prediction using the pattern, not a guess: December is winter, so daylight should be short like January.
- Treats the daylight number as something that keeps changing month to month, not as a fixed "12 hours every day in winter." That is the easiest place to slip.
June has the most daylight with 14 hours. January has the least with 10 hours. I think December will have 12 hours of daylight. Every day in winter has 12 hours.
The daylight goes up from January to June, then it goes back down. January is 10 hours, March is 12, and June is the most at 14 hours. Then September drops back to 12. So I think December will be about 10 hours, like January. December is winter, and winter has short days, so the daylight should be low again.
The daylight climbs from 10 hours in January up to 14 hours in June, then falls back down to 12 in September. So June is near the longest day and the year goes in a cycle: short, then long, then short again. I predict December will be about 10 hours, close to January, because December is deep in winter and the days are at their shortest. The change happens a little at a time, so December should be near the bottom, not a sudden drop.
I think temperature would follow almost the same shape. If we also wrote down the high temperature each month, the warmest months would line up near June when daylight is longest, and the coldest months would line up near December and January when daylight is shortest. More daylight means more hours of sunshine warming the ground.
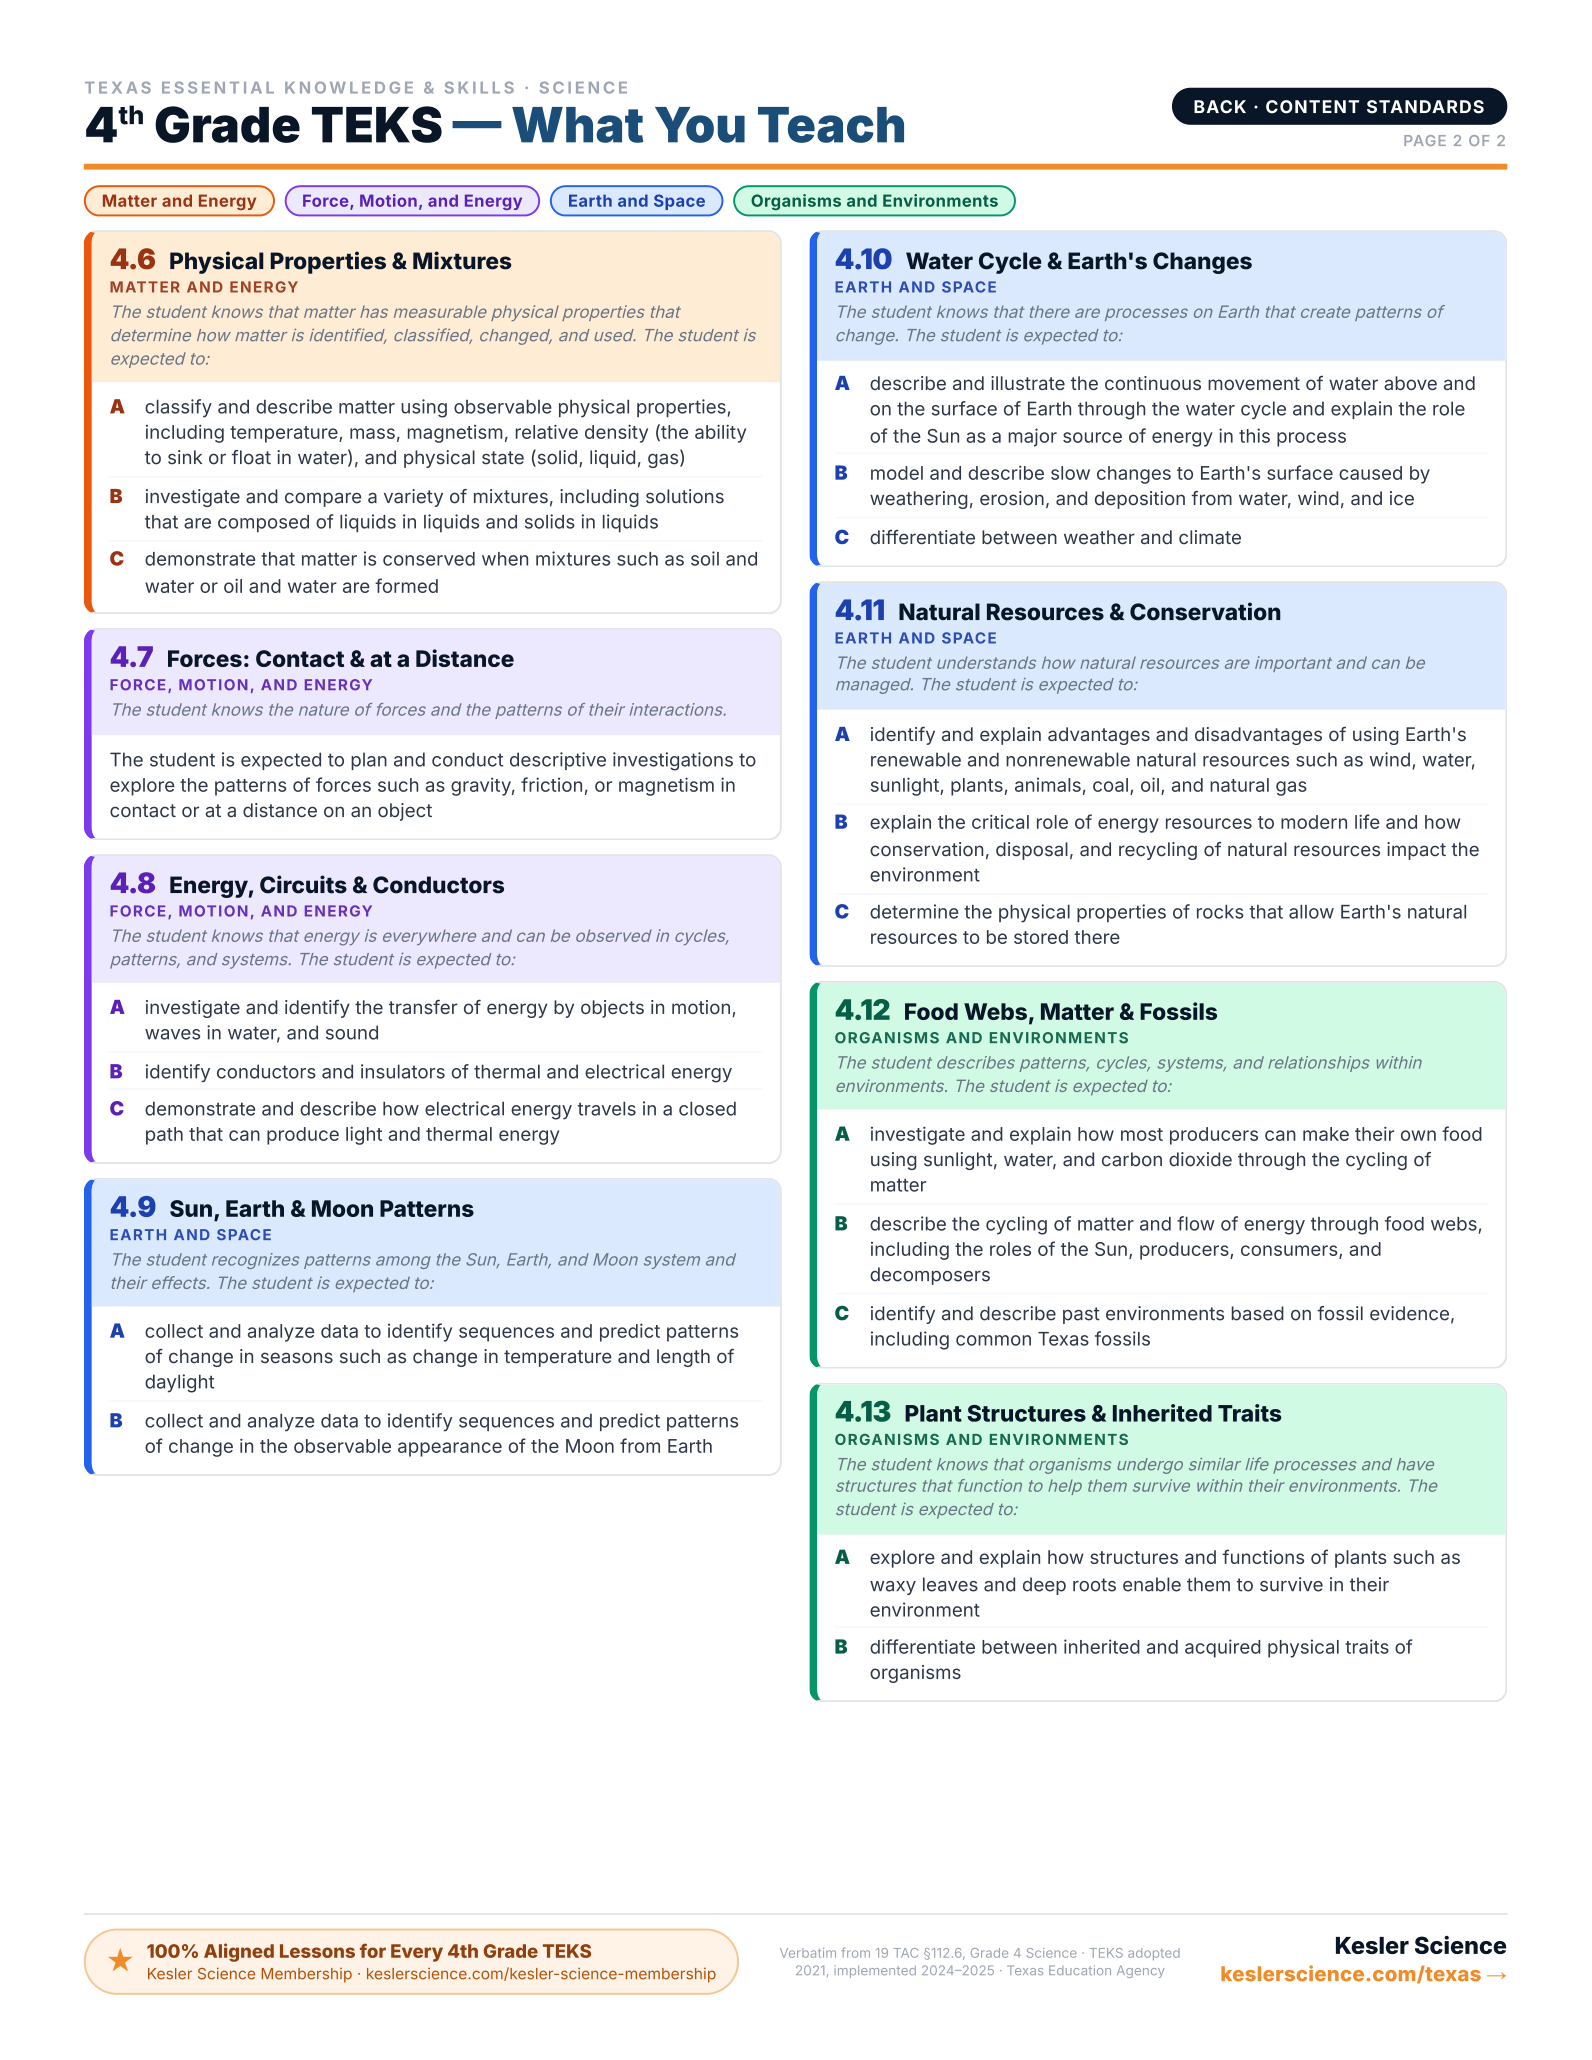
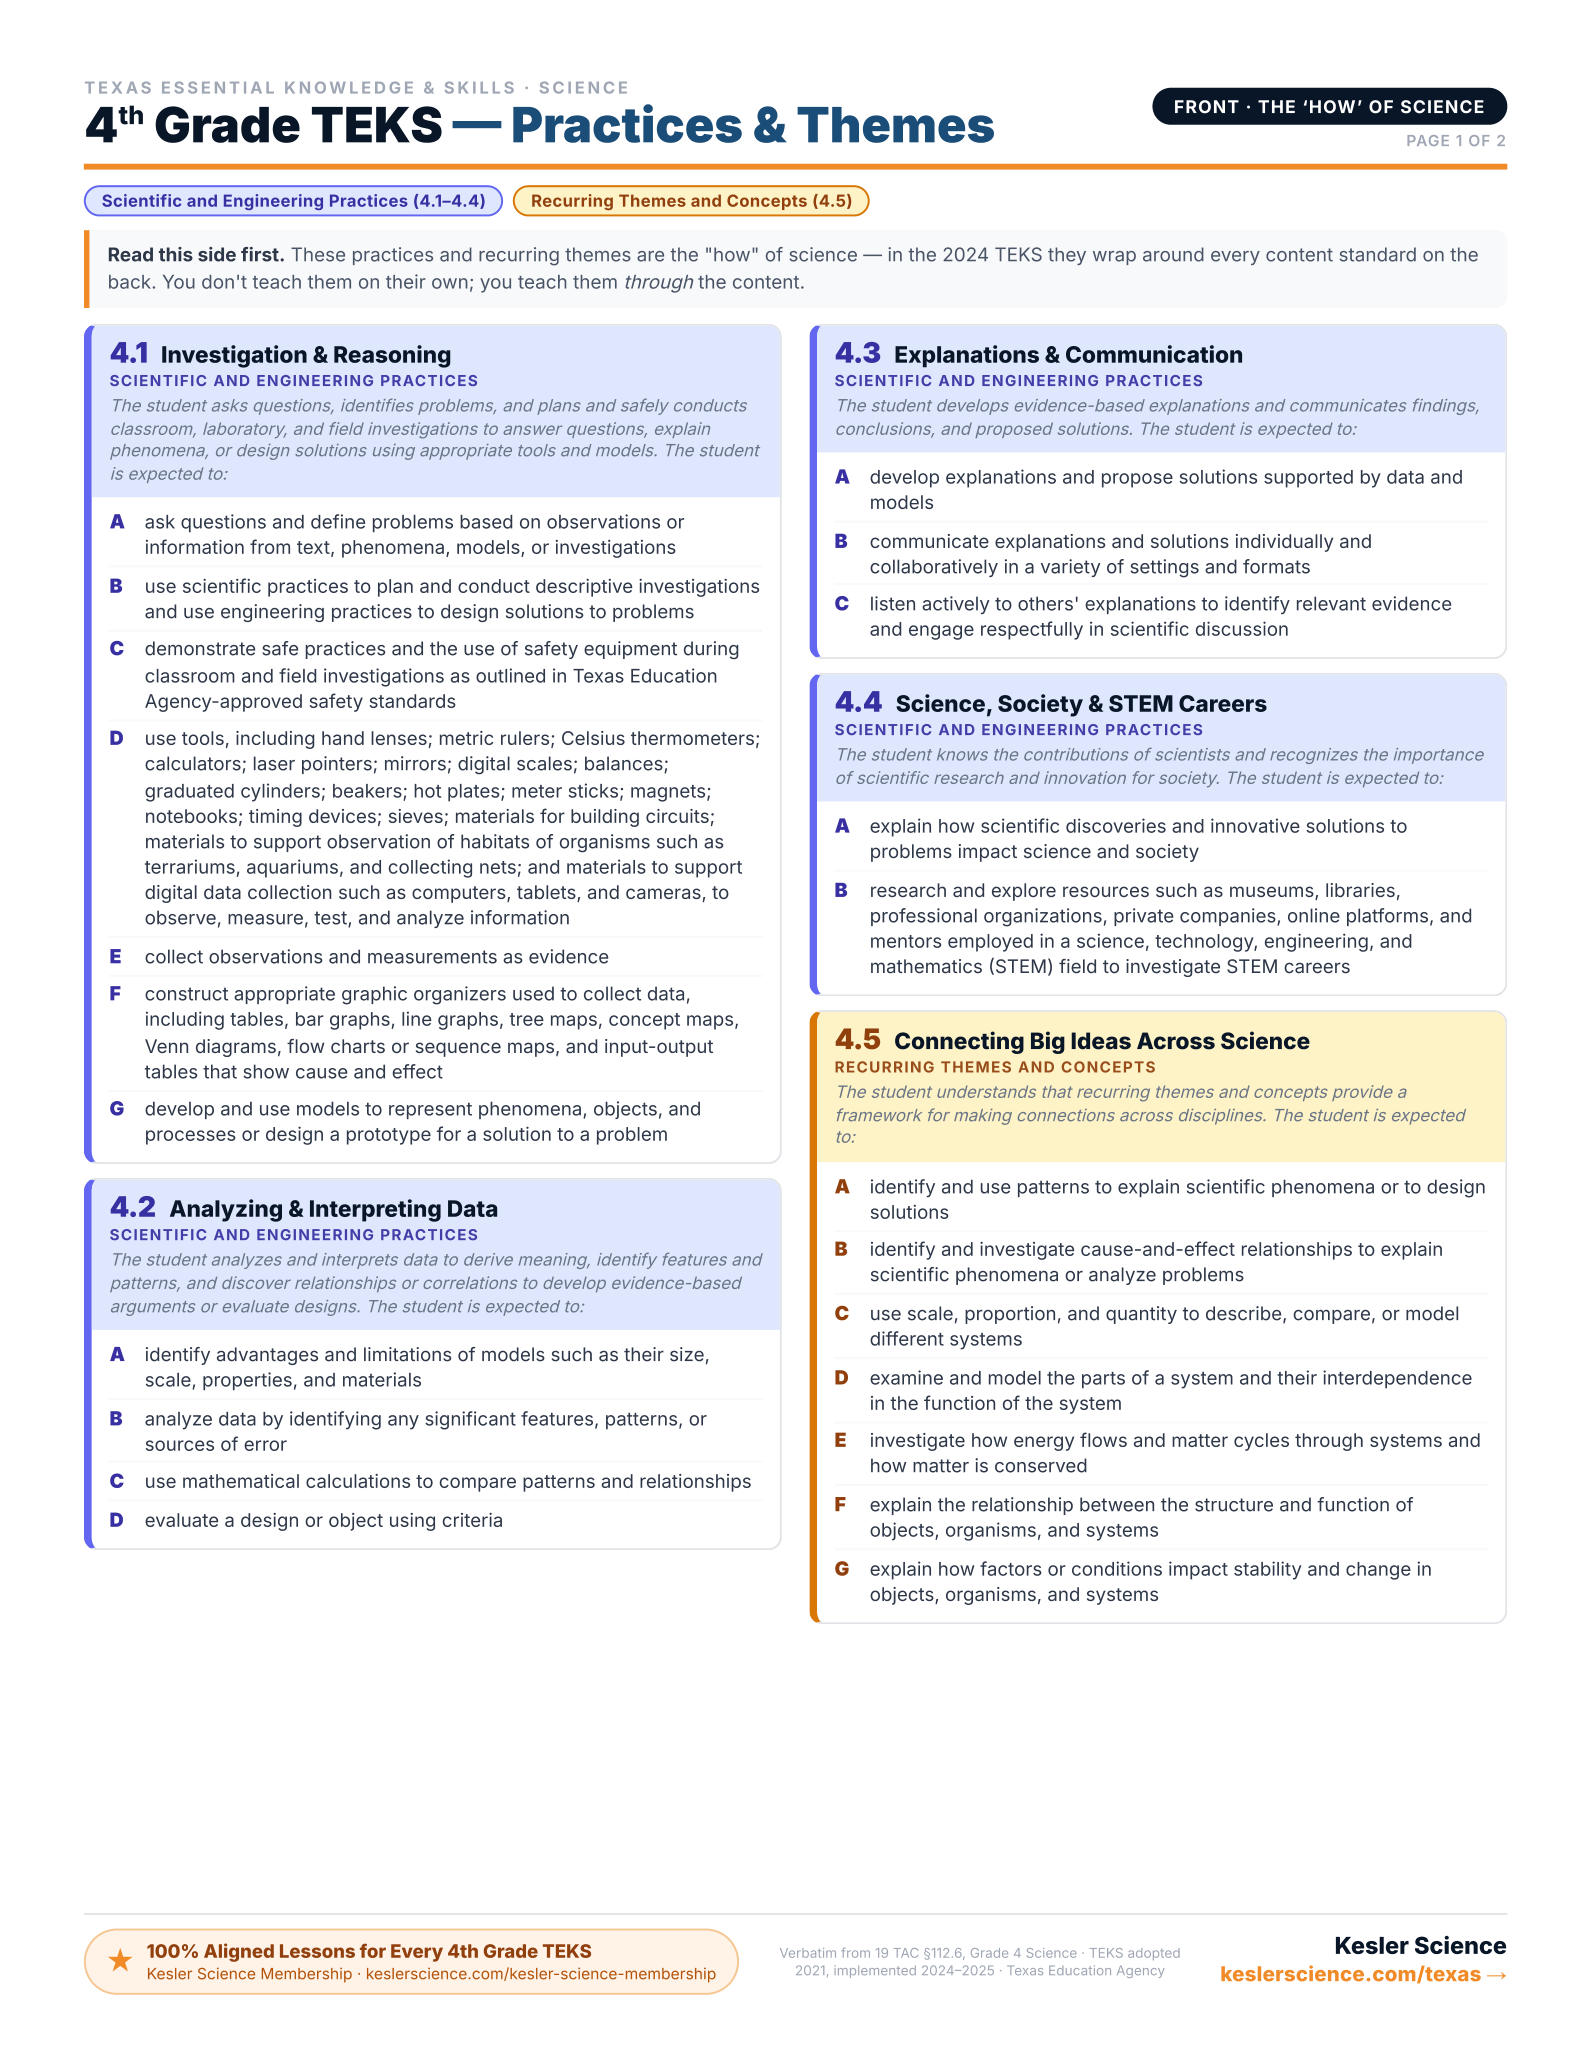
Every 4th-Grade Science TEKS on One Page
The color-coded, front-and-back cheat sheet I wish I'd had — every standard, organized by reporting category. Print it and reference it all year long. This will be your new favorite document!
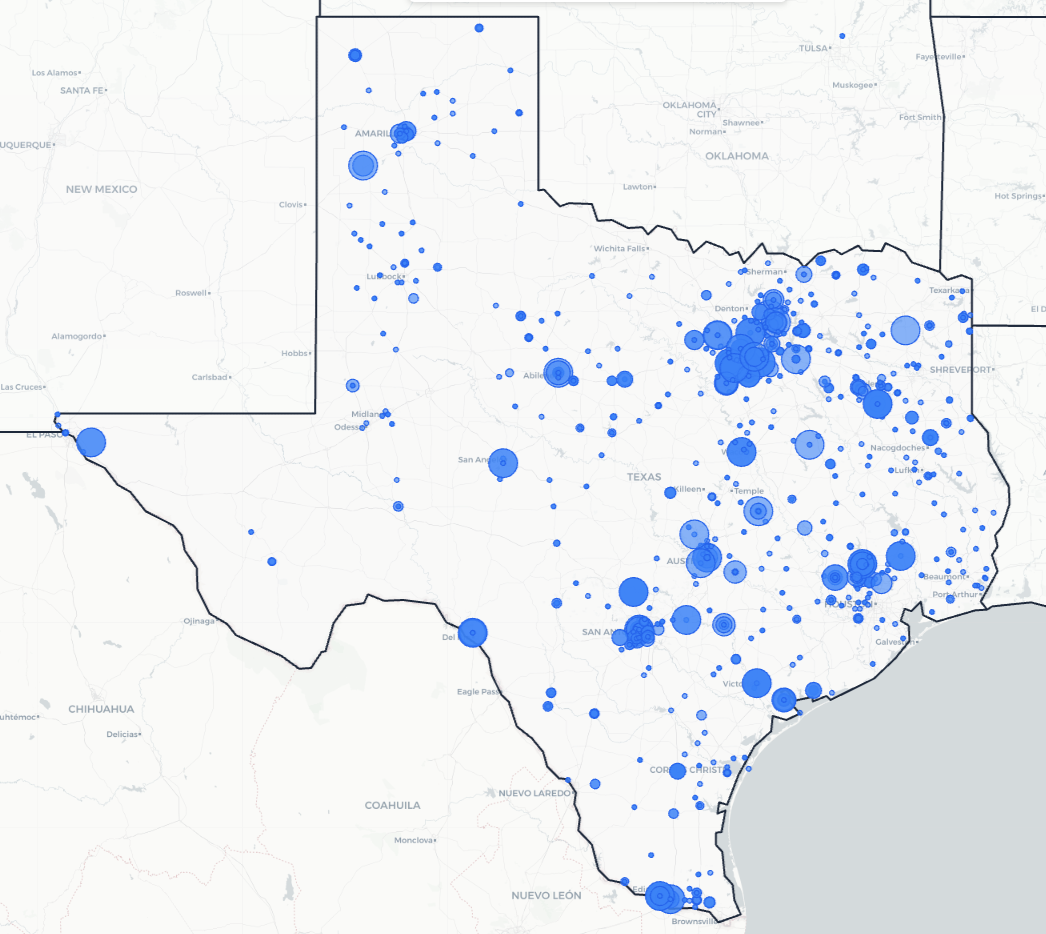
Trusted Across Texas
From the Rio Grande Valley to the Panhandle, Texas science teachers are using Kesler Science to save time and engage students.
Texas Schools and Districts
Love Kesler Science
What Teachers Are Saying
Give Your Science Teachers Everything They Need
School and district licenses give your teachers access to every resource they need, including station labs, inquiry labs, anchoring phenomena, presentations, escape rooms, and much more. One purchase covers the grade levels you need.
- PO-friendly. We accept purchase orders
- Volume discounts for 11+ teachers
- Complimentary Kesler Science Plus orientation for 4+ teachers
- Three free implementation PD sessions for departments of 11+
- Aligned to the 2024 TEKS standards
See It in Action
Book a walkthrough and we'll show you how Kesler Science fits your campus.
Book Demo CallNo pressure, no hard sell