.png?width=375&height=100&name=WebPage%20logo%20with%20curves%202026%20(8).png)
Texas Science Teacher Resource Hub
Free scope and sequences, TEKS breakdowns, phenomenon ideas, and engagement activities for the 2024 Texas science standards.

🚀 Jump to Your Grade
Pick your grade level and go straight to your TEKS standards, aligned resources, and teaching tools.
-
4th
→4th Grade Science20 standards • Matter, Earth, Energy & more
-
5th
→5th Grade Science19 standards • Matter, Ecosystems, Space & more
-
6th
→6th Grade Science24 standards • Forces, Energy, Matter & more
-
7th
→7th Grade Science27 standards • Cells, Chemistry, Earth & more
-
8th
→8th Grade Science24 standards • Newton's Laws, Space, Genetics & more
7th Grade TEKS Standards
Click any standard to see what it means, how to teach it, where students get stuck, and aligned resources.
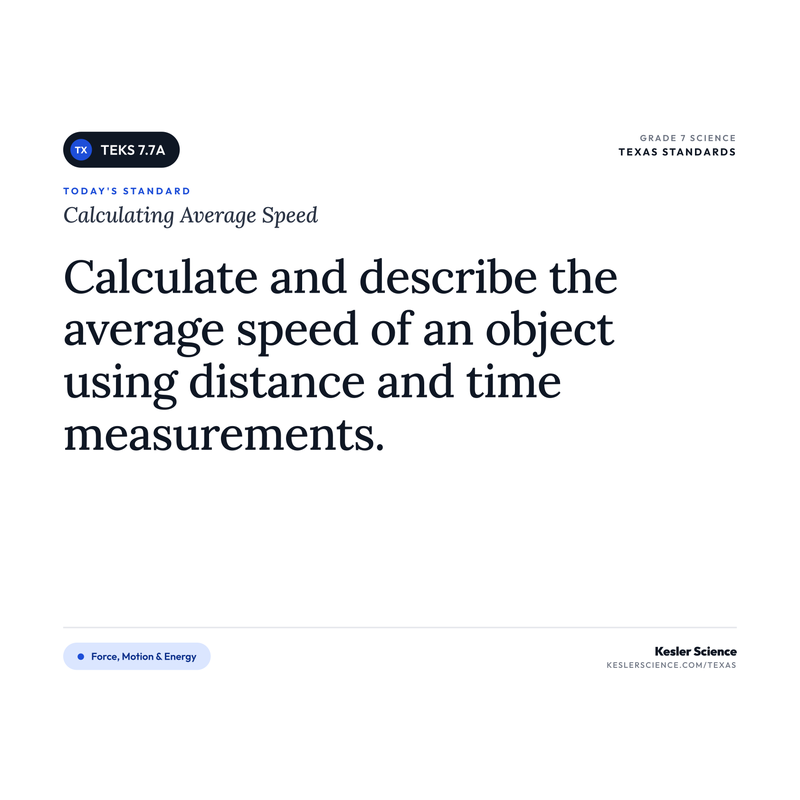
Calculating Average Speed
"Calculate average speed using distance and time measurements from investigations."
💡 What This Standard Actually Means
"Calculate". Students are calculating average speed using distance and time measurements from investigations. The new wording emphasizes that the data should come from actual investigations, not just made-up word problems. Kids need reps with the formula speed = distance ÷ time and they need to apply it to their own measurements. Instruction can take many forms, such as walking labs with stopwatches, toy car ramp investigations, hallway-distance speed challenges, and data-table-to-calculation worksheets.
Average speed is how much distance an object covers in a given amount of time. The math is simple: take the total distance, divide by the total time. If a student walks 100 meters in 50 seconds, their average speed is 2 meters per second.
The word average is the part that trips kids up. Average speed doesn't mean the object was moving at that exact speed the whole time. It's what the speed works out to overall. A car that sits at a red light for 30 seconds, then drives 60 mph for a minute, has an average speed somewhere in between. Instantaneous speed (what a speedometer shows at a single moment) is a different idea, and students often blur the two together.
Units matter a lot in this standard. The three most common units are meters per second (m/s), kilometers per hour (km/h), and miles per hour (mph). Students should be able to work problems in any of these as long as the distance and time units line up. If distance is in meters and time is in seconds, the answer is in m/s. Mixing units mid-problem is where wrong answers come from.
The thing that fixed average speed for me was dropping the formula for a minute and starting with a walking lab. I'd tape off a 10-meter stretch in the hallway, hand a student a stopwatch, and have another kid walk, jog, and run it. We'd fill in distance and time on the board and figure out the speed together, out loud. Only after students had calculated their own speeds a few times would I show them the formula on paper. Once they saw the formula was just a shortcut for what they'd already done with their legs and a stopwatch, the math stopped feeling like a trick and started feeling like common sense.
⚠️ Misconceptions Your Students May Have
These are some of the most common misconceptions. Knowing what to look for can help you get ahead of them.
"Average speed means the object moved at that speed the whole time"
Average speed is a summary of the whole trip, not a description of each second of it. A runner who sprints, slows down, stops for water, and sprints again can still have an average speed of 4 m/s even though her speed was different at every moment. The average smooths everything into a single number.
"You can just average the speeds to find the average speed"
If a car drives 60 mph for an hour, then 20 mph for an hour, the average speed is 40 mph because the time spent at each speed is equal. But if a car drives 60 mph for 10 miles, then 20 mph for 10 miles, the answer is not 40 mph. Average speed uses total distance divided by total time. Students should always go back to the full distance and full time, not shortcut through the middle.
"The units don't really matter as long as I get the number right"
Units carry half the meaning. A speed of 5 m/s and 5 mph are nowhere close to the same thing. Students need to show their units in every answer and make sure the distance and time units match what the problem is asking for before they divide.
"Speed and time are the same thing because they both show how long something takes"
Time is how long something takes. Speed is how much ground was covered per unit of time. They feel related because both show up in a race, but in the formula they're doing very different jobs. Time is the denominator. Speed is the result.
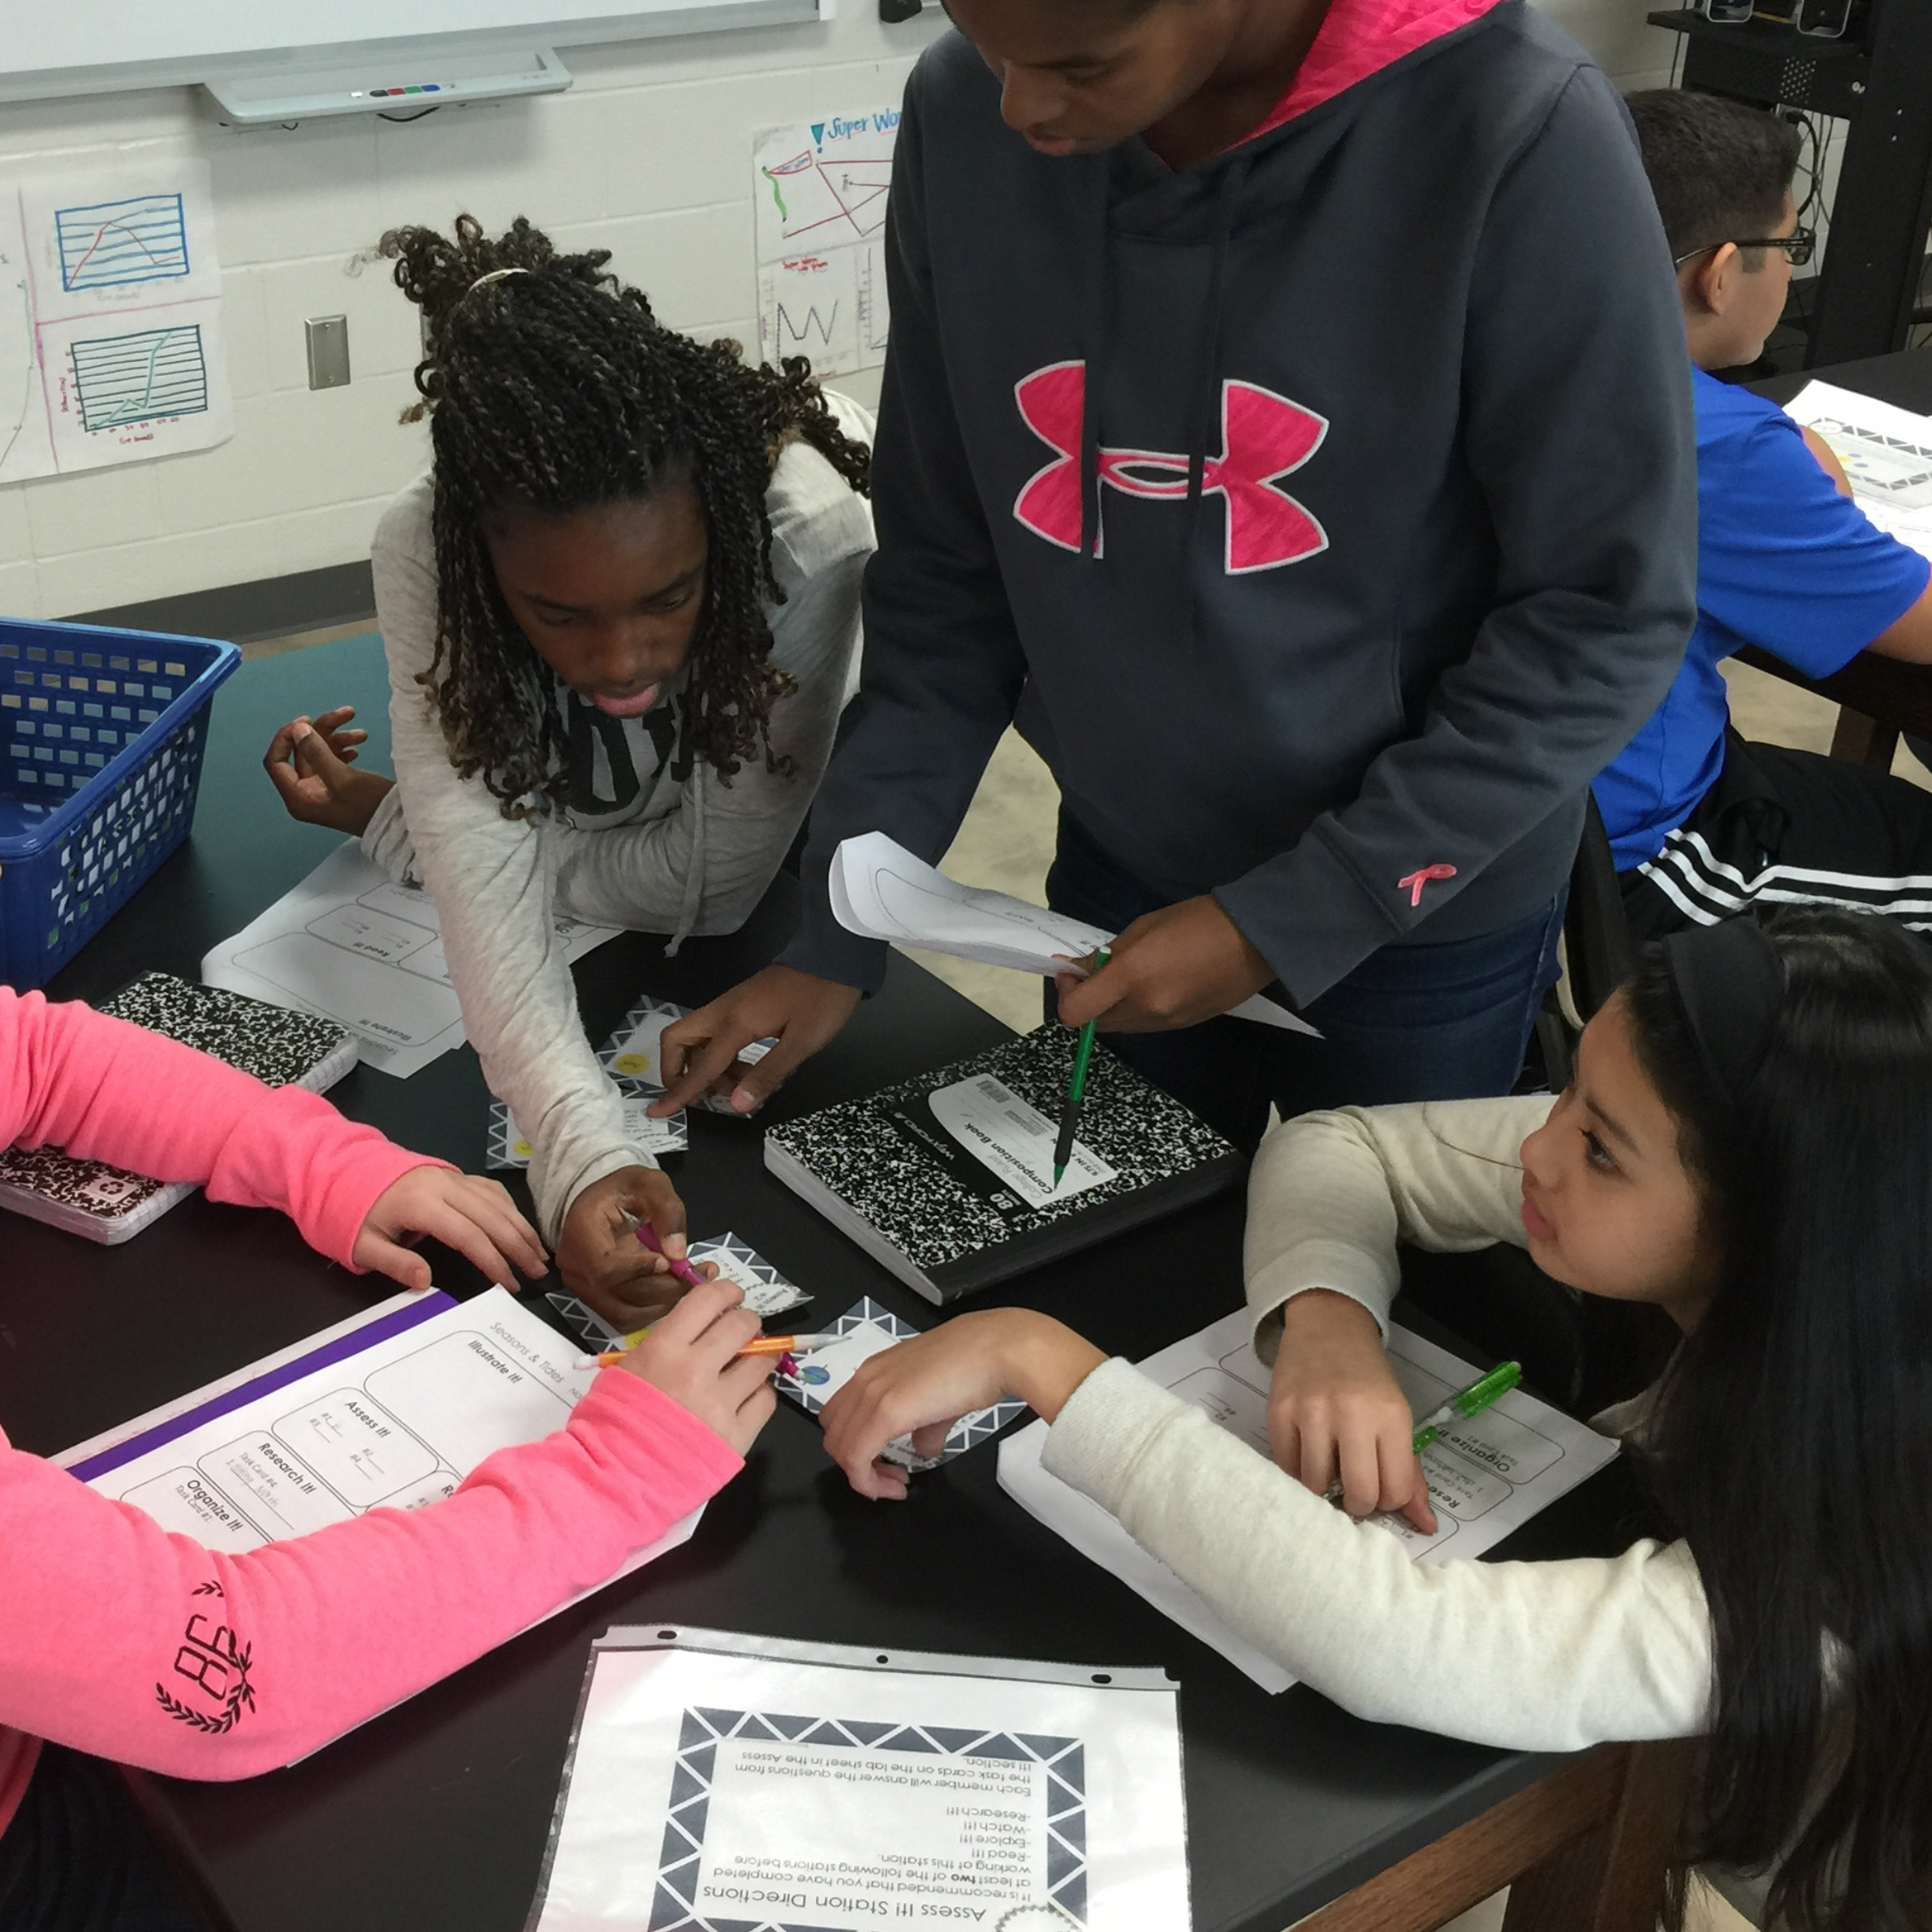
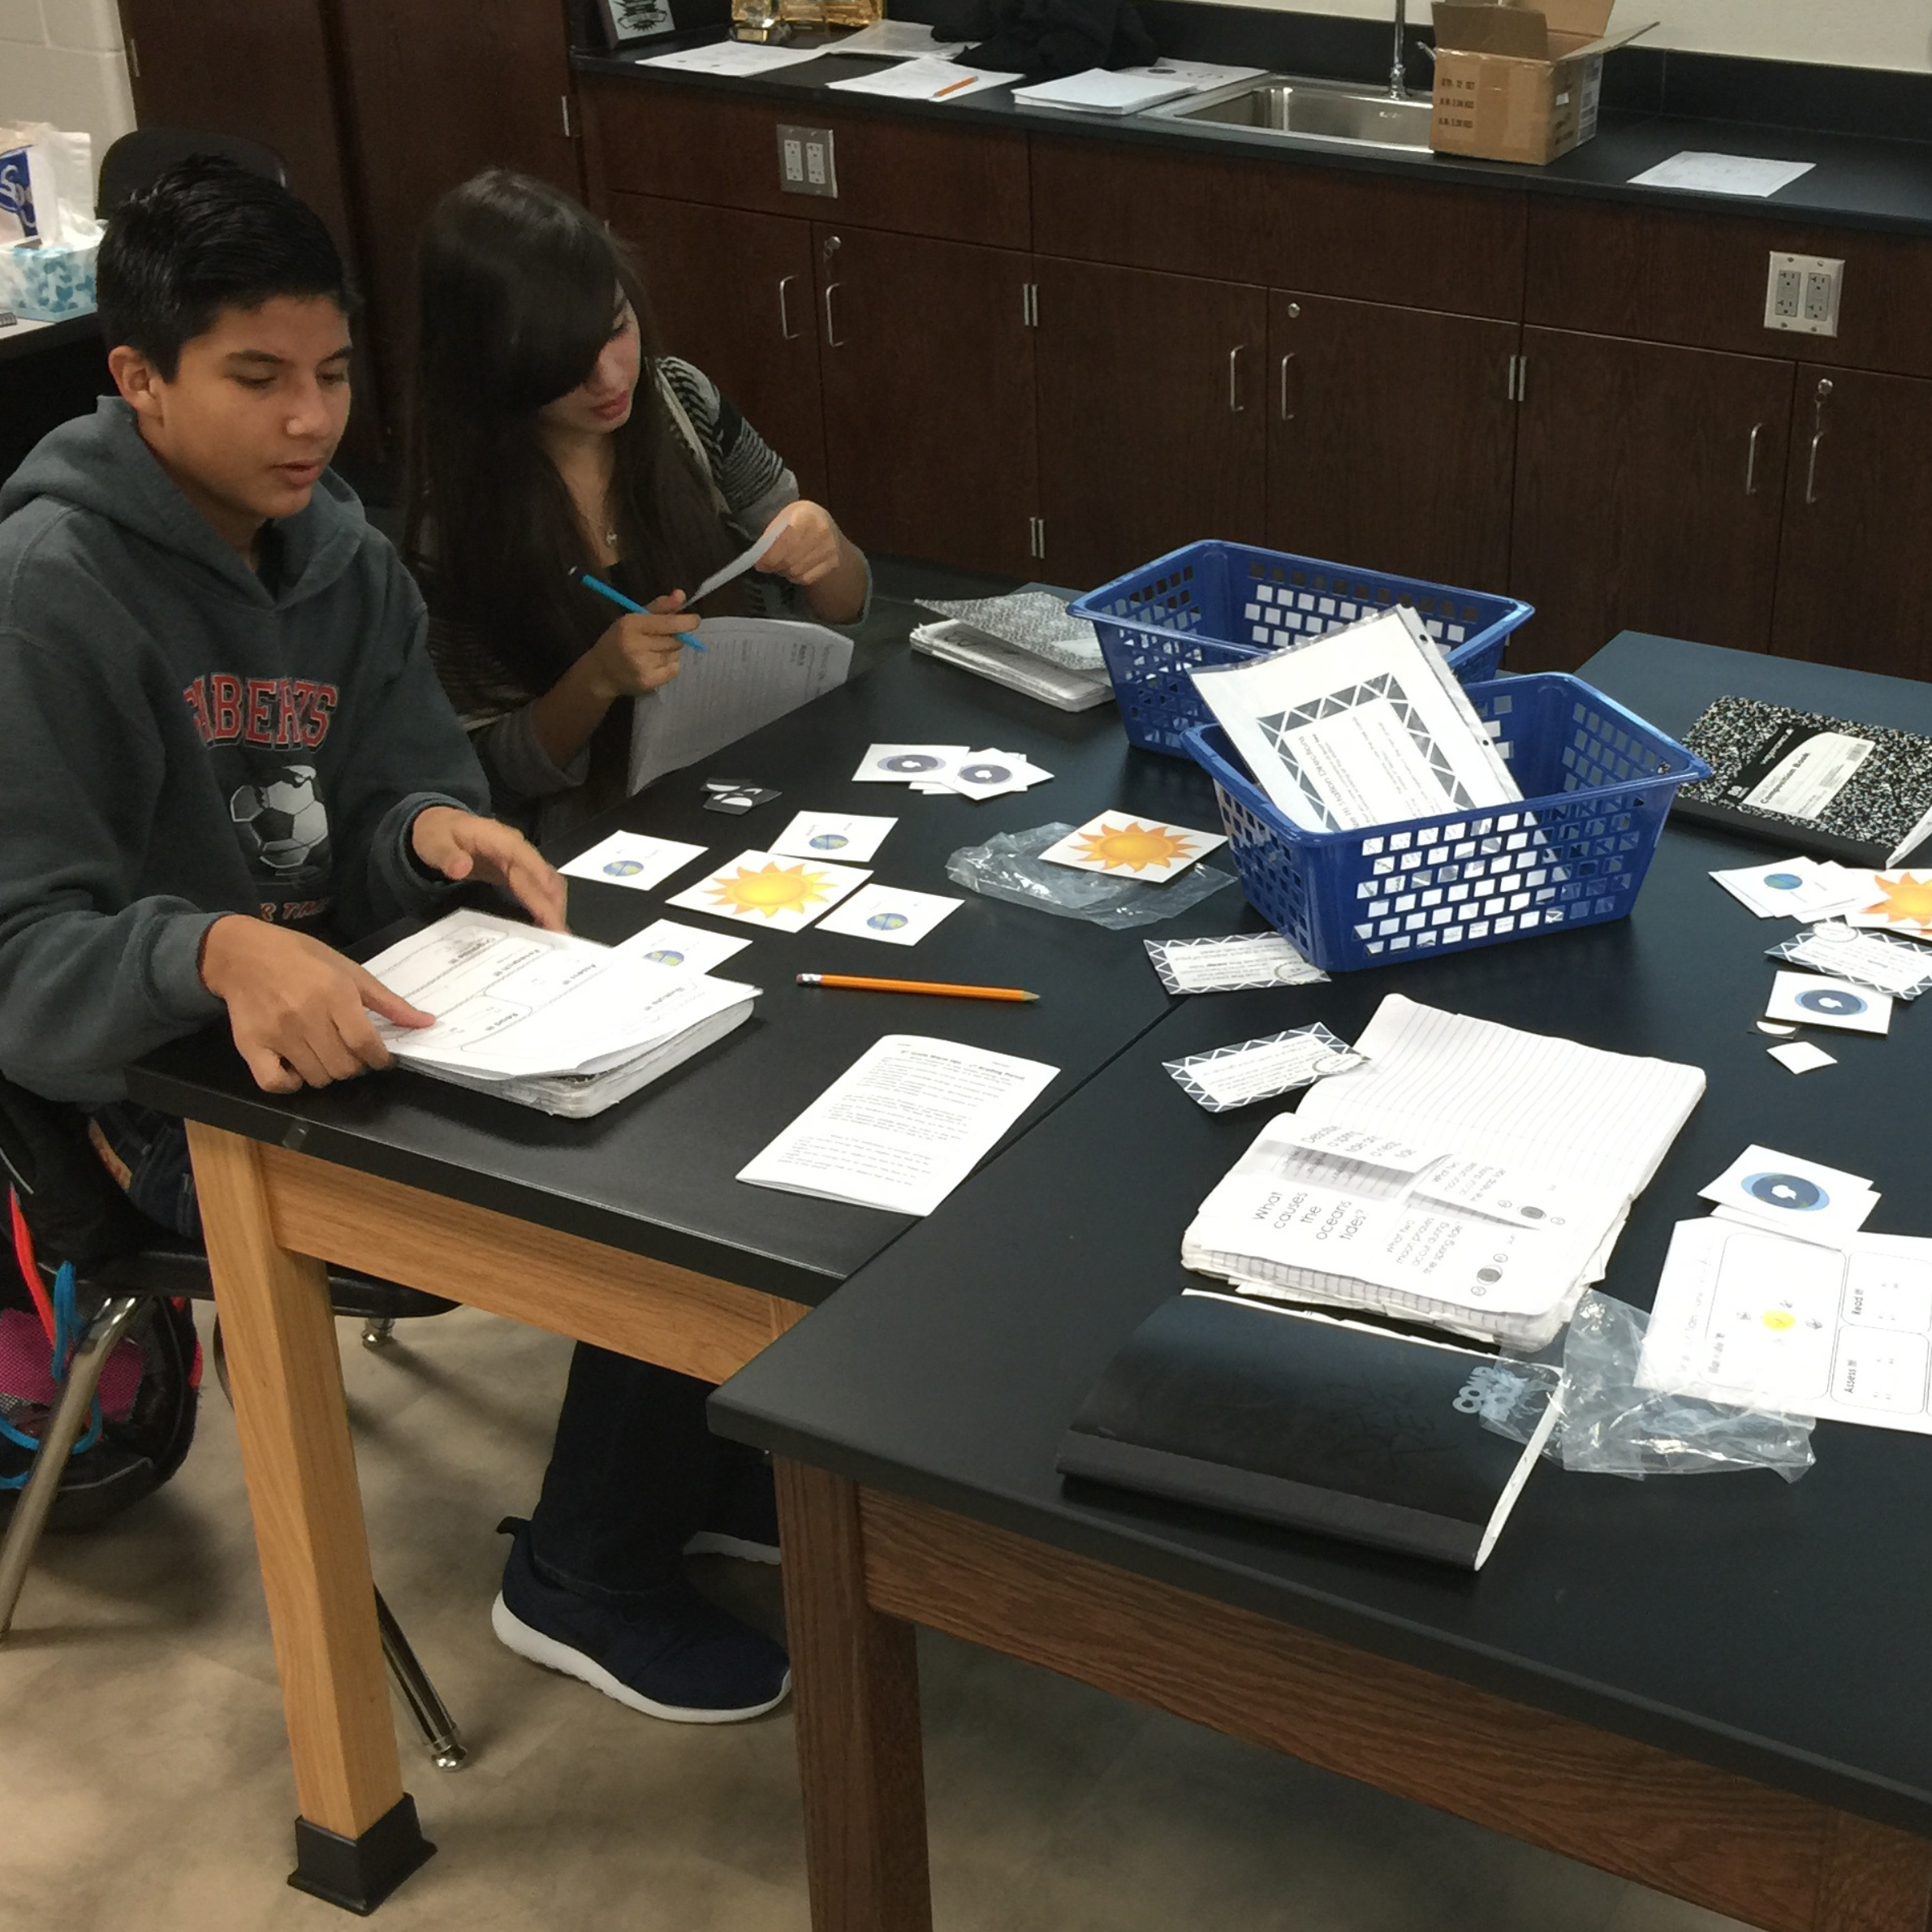
📓 Teaching Resources for 7.7A
These resources are aligned to this standard.


100% Aligned Lessons for Every TEKS You Teach
Kesler Science Plus puts thousands of ready-to-teach lessons and activities in your hands, so you can boost engagement and get your planning time back. Trusted by schools and districts all over the great state of Texas.
🌎 Phenomenon Ideas for 7.7A
Use these real-world phenomena to anchor your lesson. Show students the phenomenon first, let them wonder, then build toward Calculating Average Speed as the explanation.
Usain Bolt's 100-Meter World Record
Usain Bolt set the world record for the 100-meter dash at 9.58 seconds in 2009. That means he ran 100 meters in less than ten seconds. But here's the interesting part: his top speed during the race was much faster than his average speed, because he had to start from a complete stop and accelerate out of the blocks. One number describes the whole race. Another describes a single moment inside it.
"What was Bolt's average speed during his world-record run? Do you think he was moving at that speed the entire race, or did his speed change? How would you figure out his fastest moment?"
A Road Trip From Dallas to Houston
The drive from Dallas to Houston on I-45 is about 240 miles. A family leaves at 8:00 a.m. and arrives at 12:00 p.m. That's 240 miles in 4 hours. But during the trip, they hit construction, stopped for gas, and drove 75 mph on open stretches. Their speedometer was all over the place. So what does it even mean to say their "speed" was a certain number?
"What was the family's average speed for the whole trip? Why is that number different from what the speedometer showed most of the time? Which number do you think a trip-planning app would use to estimate your arrival time?"
The Tortoise vs. the Cheetah Problem
A cheetah can sprint at roughly 60 mph for short bursts, but usually for less than a minute before it has to rest. A tortoise moves at about 0.2 mph but can keep going all day. Over a single minute of sprinting, the cheetah wins easily. Here is an invented scenario to isolate the idea of average speed (in real life a cheetah walks between sprints and would still out-cover a tortoise over a day, so we are freezing that out on purpose): the cheetah takes one 60 mph sprint and then sits still for the rest of the hour, while the tortoise walks steadily the whole hour. Have students compute each animal's average speed over that full hour.
"In that hour, who ends up with the higher average speed, the cheetah or the tortoise? How can the slower-looking animal come out ahead on average? What does that tell us about the difference between top speed and average speed?"
💡 Free Engagement Ideas for 7.7A
Hallway Walking Lab
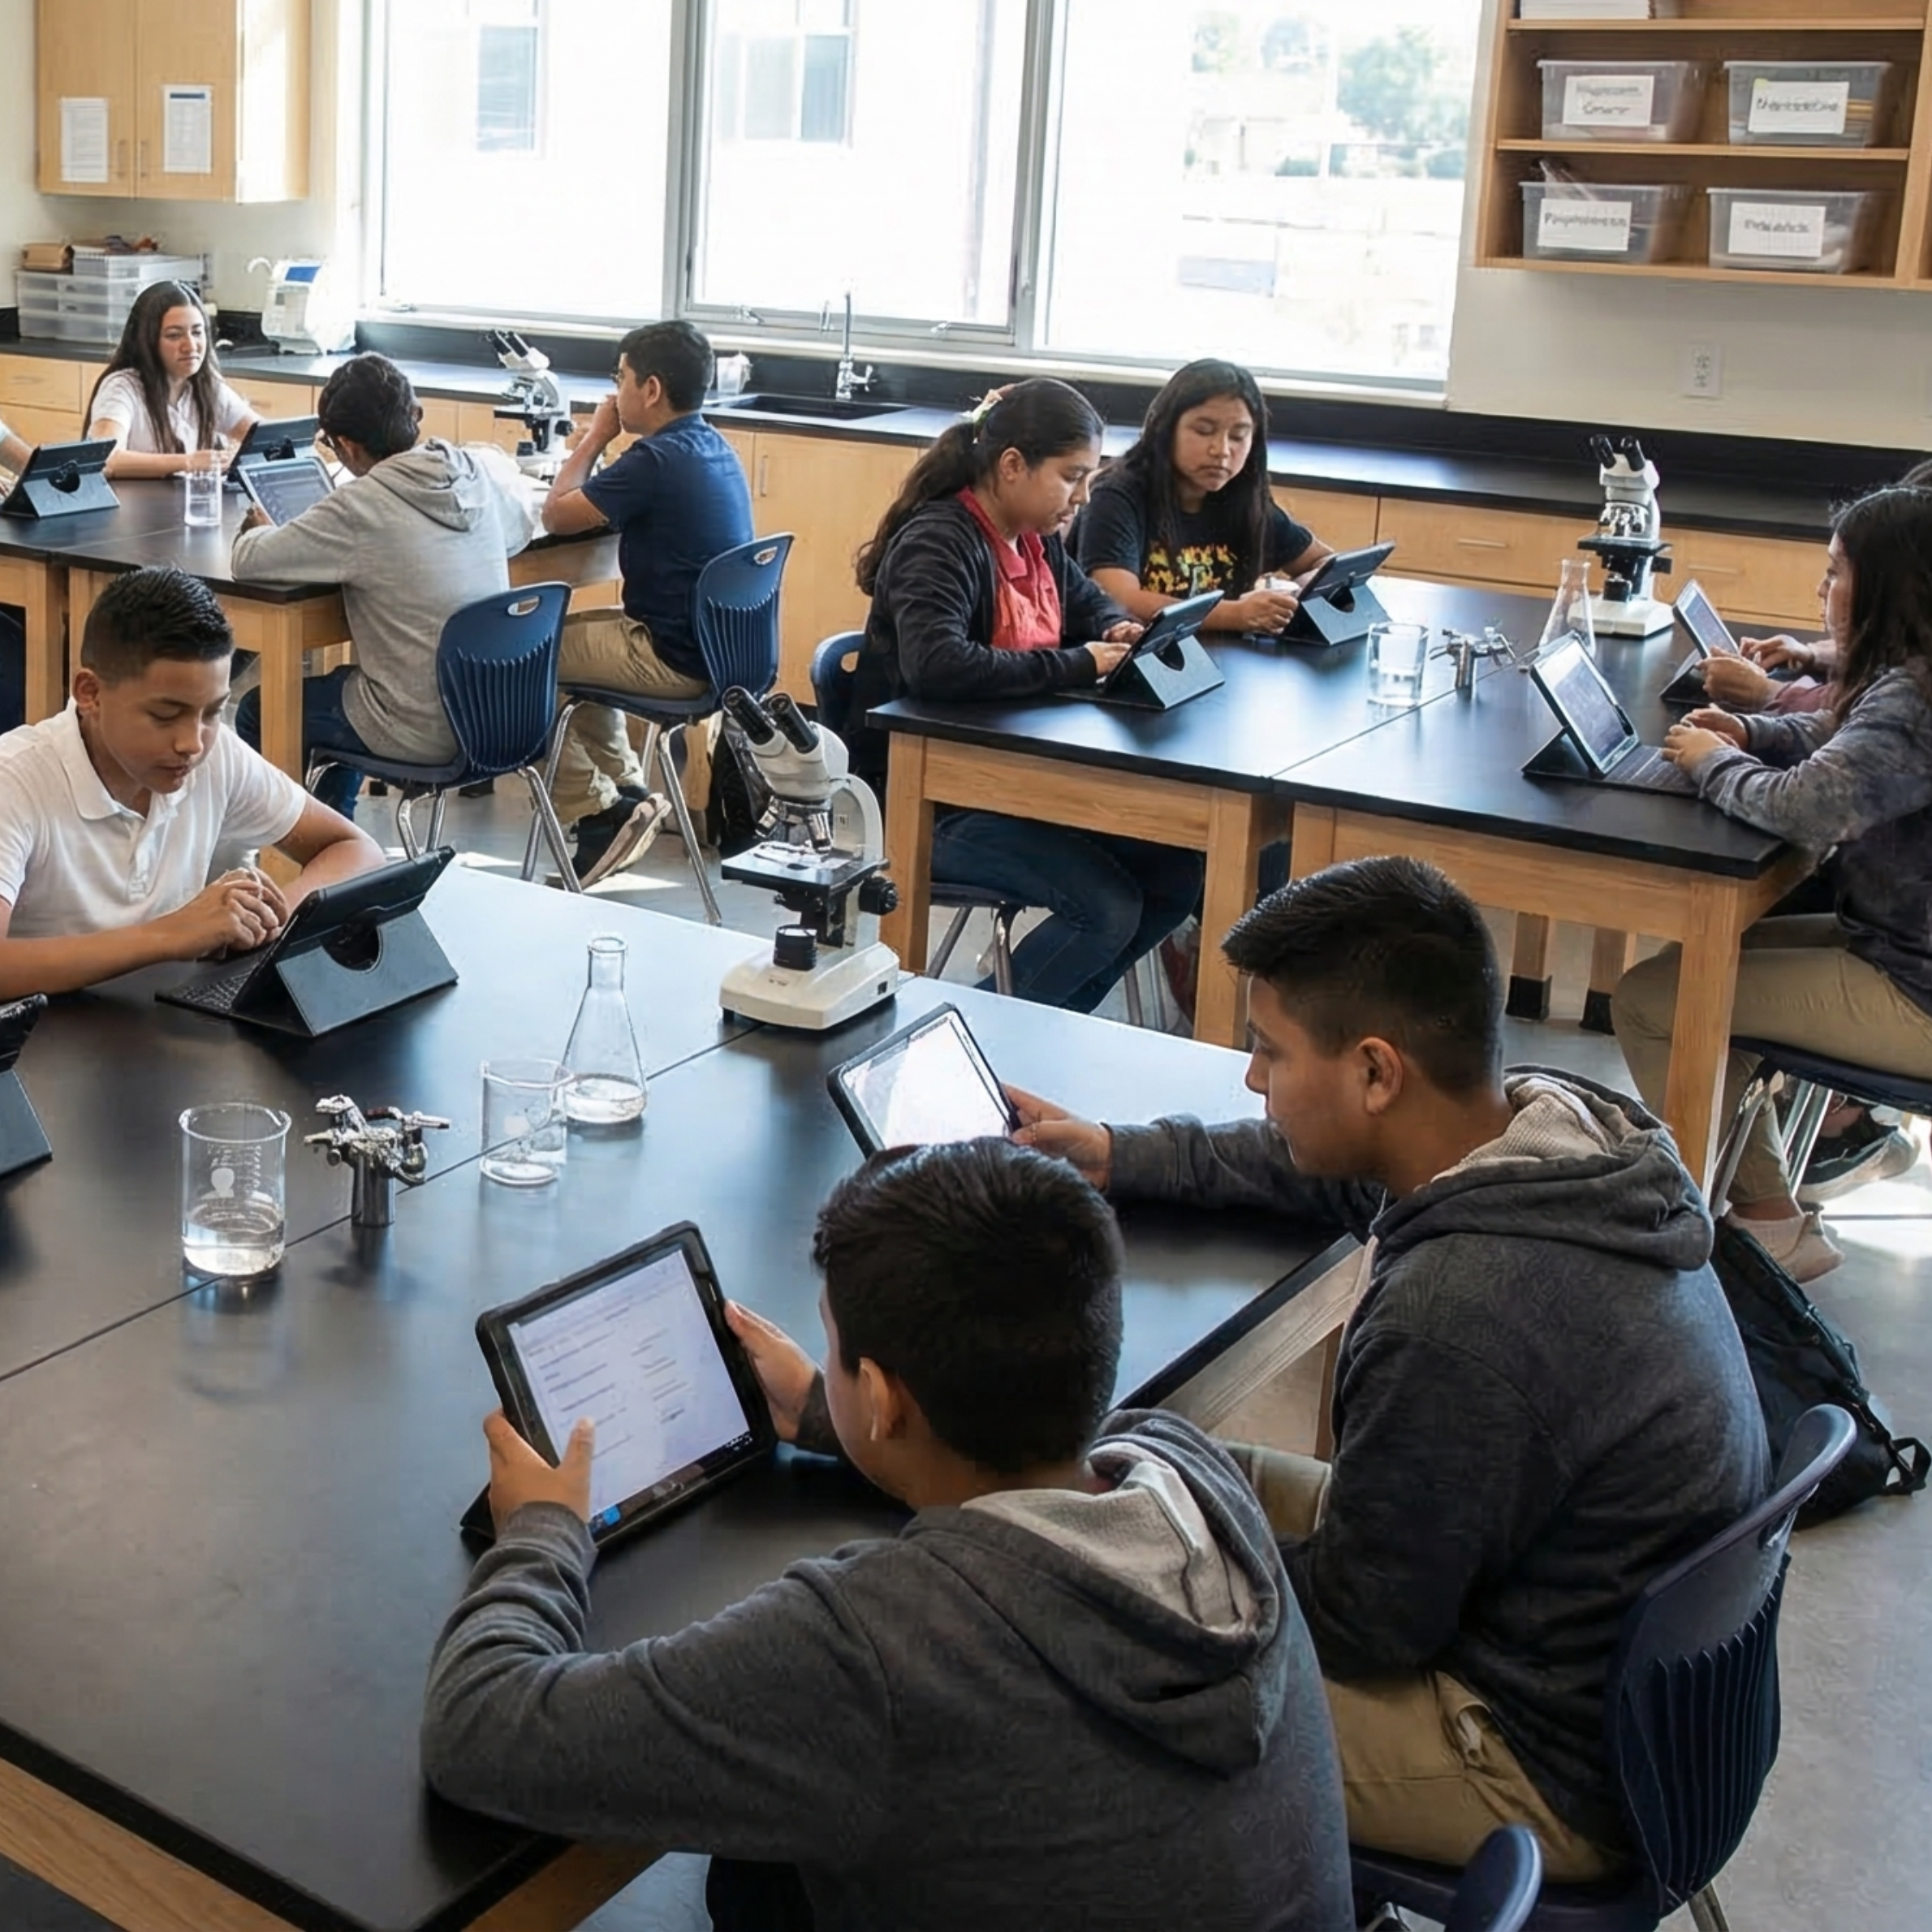
Tape off a 10-meter stretch in the hallway. Students walk, jog, and run the distance while a partner times them. Each student calculates their speed for each pace and records it in m/s. They'll feel the difference between walking and running in their legs and see it on paper at the same time.
Toy Car Speed Trials
Give each group a wind-up or pull-back toy car and a meter stick. Students release the car three times, measure the distance it travels, and time how long each run takes. Then they calculate the average speed for each trial and average their results. Great for practicing unit consistency.
The Paper Airplane Olympics
Each student folds a paper airplane and throws it three times across the room. Have a partner measure the distance the plane traveled and the approximate time it was in the air. Students calculate the average speed of each flight. Compare fast planes, slow gliders, and the averages across different designs.
Rolling Marbles on a Ramp
Prop one end of a textbook up with another book to make a ramp. Students release a marble from the top and time how long it takes to reach a finish line taped on the floor. Measure the distance, record the time, and calculate speed. Then change the ramp height and repeat. Students can see how changing one variable affects their speed calculations.
🎯 What Approaches, Meets, and Masters Thinking Look Like
Here is what student thinking at each level looks like on this one task, so you know what to look for and how to move a student up.
In a hallway investigation, Maria rolled a toy car and timed it. The car traveled 12 meters in 4 seconds. It rolled fast at the start, slowed down in the middle, then sped back up at the end. Calculate the car's average speed. Show your formula and your units. Then explain what that average speed number actually tells you about the car's trip.
- The correct formula written out: speed = distance ÷ time.
- The right numbers plugged in: 12 meters divided by 4 seconds.
- The correct answer with units: 3 m/s (meters per second).
- Distance and time units that match the answer (meters and seconds give m/s, not just a bare number like “3”).
- An explanation of what the average means: the speed the trip works out to overall, using total distance and total time.
- Recognition that the car was not going exactly 3 m/s the whole time, since it sped up and slowed down. The average smooths the whole trip into one number. That is the part that takes real reasoning.
Speed = distance ÷ time. So 12 ÷ 4 = 3 m/s. The car's average speed was 3 m/s. That means the car was going 3 m/s the whole time it rolled down the hallway.
Speed = distance ÷ time = 12 meters ÷ 4 seconds = 3 m/s. The average speed is 3 m/s. It does not mean the car went 3 m/s the whole time. The car was faster at the start and slower in the middle. The 3 m/s is just what the whole trip works out to when you take the total distance and divide by the total time. It is a summary of the trip, not the speed at every second.
Speed = distance ÷ time = 12 meters ÷ 4 seconds = 3 m/s. The average speed is 3 m/s. This is the speed for the whole trip, total distance divided by total time. It does not mean the car moved at 3 m/s every second. Since it sped up at the start and slowed down in the middle, its real speed was higher than 3 at some points and lower than 3 at others, but it all balances out to 3 m/s overall.
This is the same idea as my bus ride to school. The bus stops at red lights and stops to pick up kids, then drives fast between stops. If you took the total distance to school and divided by the total time, you would get one average speed, even though the bus was actually stopped sometimes and fast other times. The average does not show any single moment. It rolls the whole trip up into one number.
Every 7th-Grade Science TEKS on One Page
The color-coded, front-and-back cheat sheet I wish I'd had — every standard, organized by reporting category. Print it and reference it all year long. This will be your new favorite document!
Trusted Across Texas
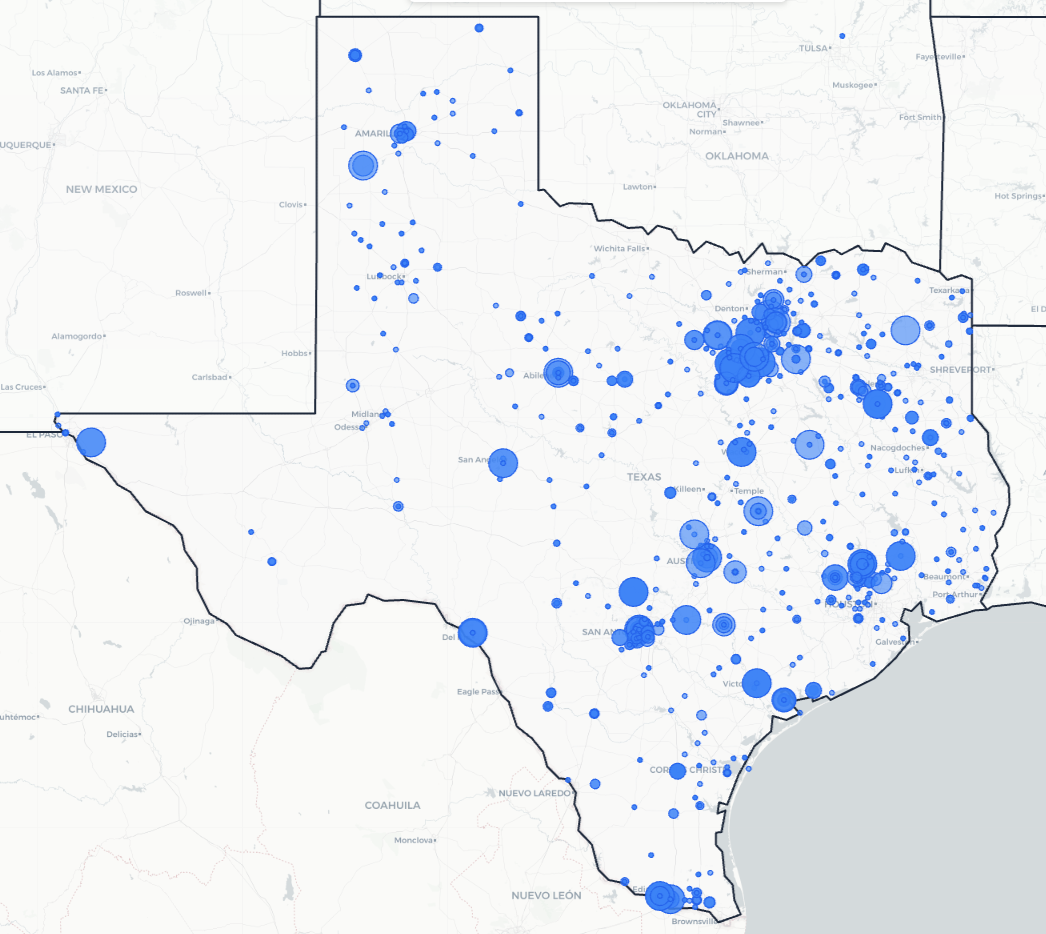
From the Rio Grande Valley to the Panhandle, Texas science teachers are using Kesler Science to save time and engage students.
Texas Schools and Districts
Love Kesler Science
What Teachers Are Saying
Give Your Science Teachers Everything They Need
School and district licenses give your teachers access to every resource they need, including station labs, inquiry labs, anchoring phenomena, presentations, escape rooms, and much more. One purchase covers the grade levels you need.
- PO-friendly. We accept purchase orders
- Volume discounts for 11+ teachers
- Complimentary Kesler Science Plus orientation for 4+ teachers
- Three free implementation PD sessions for departments of 11+
- Aligned to the 2024 TEKS standards
See It in Action
Book a walkthrough and we'll show you how Kesler Science fits your campus.
Book Demo CallNo pressure, no hard sell