.png?width=375&height=100&name=WebPage%20logo%20with%20curves%202026%20(8).png)
Texas Science Teacher Resource Hub
Free scope and sequences, TEKS breakdowns, phenomenon ideas, and engagement activities for the 2024 Texas science standards.

🚀 Jump to Your Grade
Pick your grade level and go straight to your TEKS standards, aligned resources, and teaching tools.
-
4th
→4th Grade Science20 standards • Matter, Earth, Energy & more
-
5th
→5th Grade Science19 standards • Matter, Ecosystems, Space & more
-
6th
→6th Grade Science24 standards • Forces, Energy, Matter & more
-
7th
→7th Grade Science27 standards • Cells, Chemistry, Earth & more
-
8th
→8th Grade Science24 standards • Newton's Laws, Space, Genetics & more
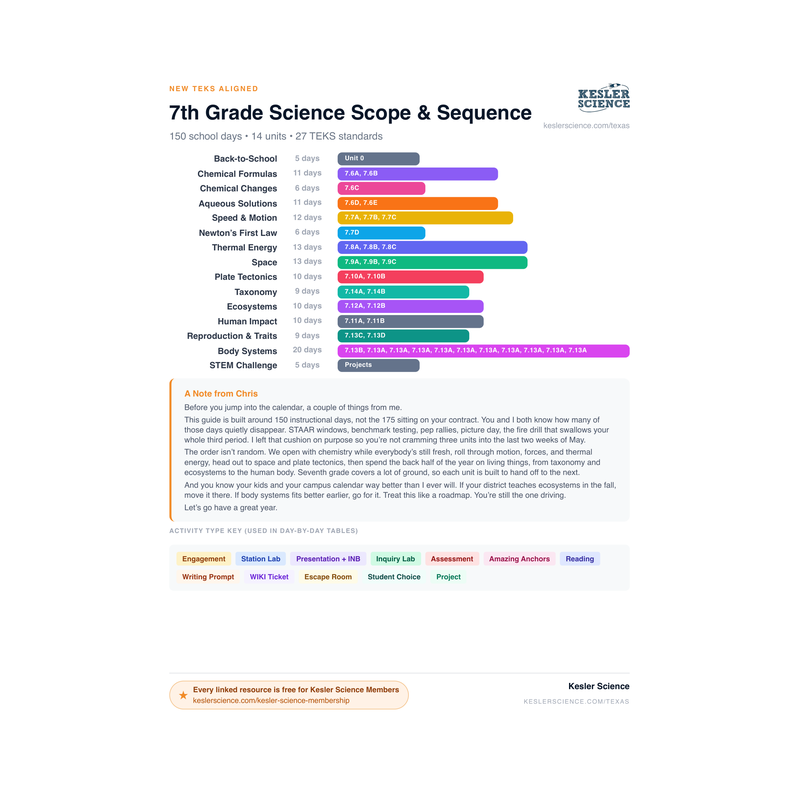
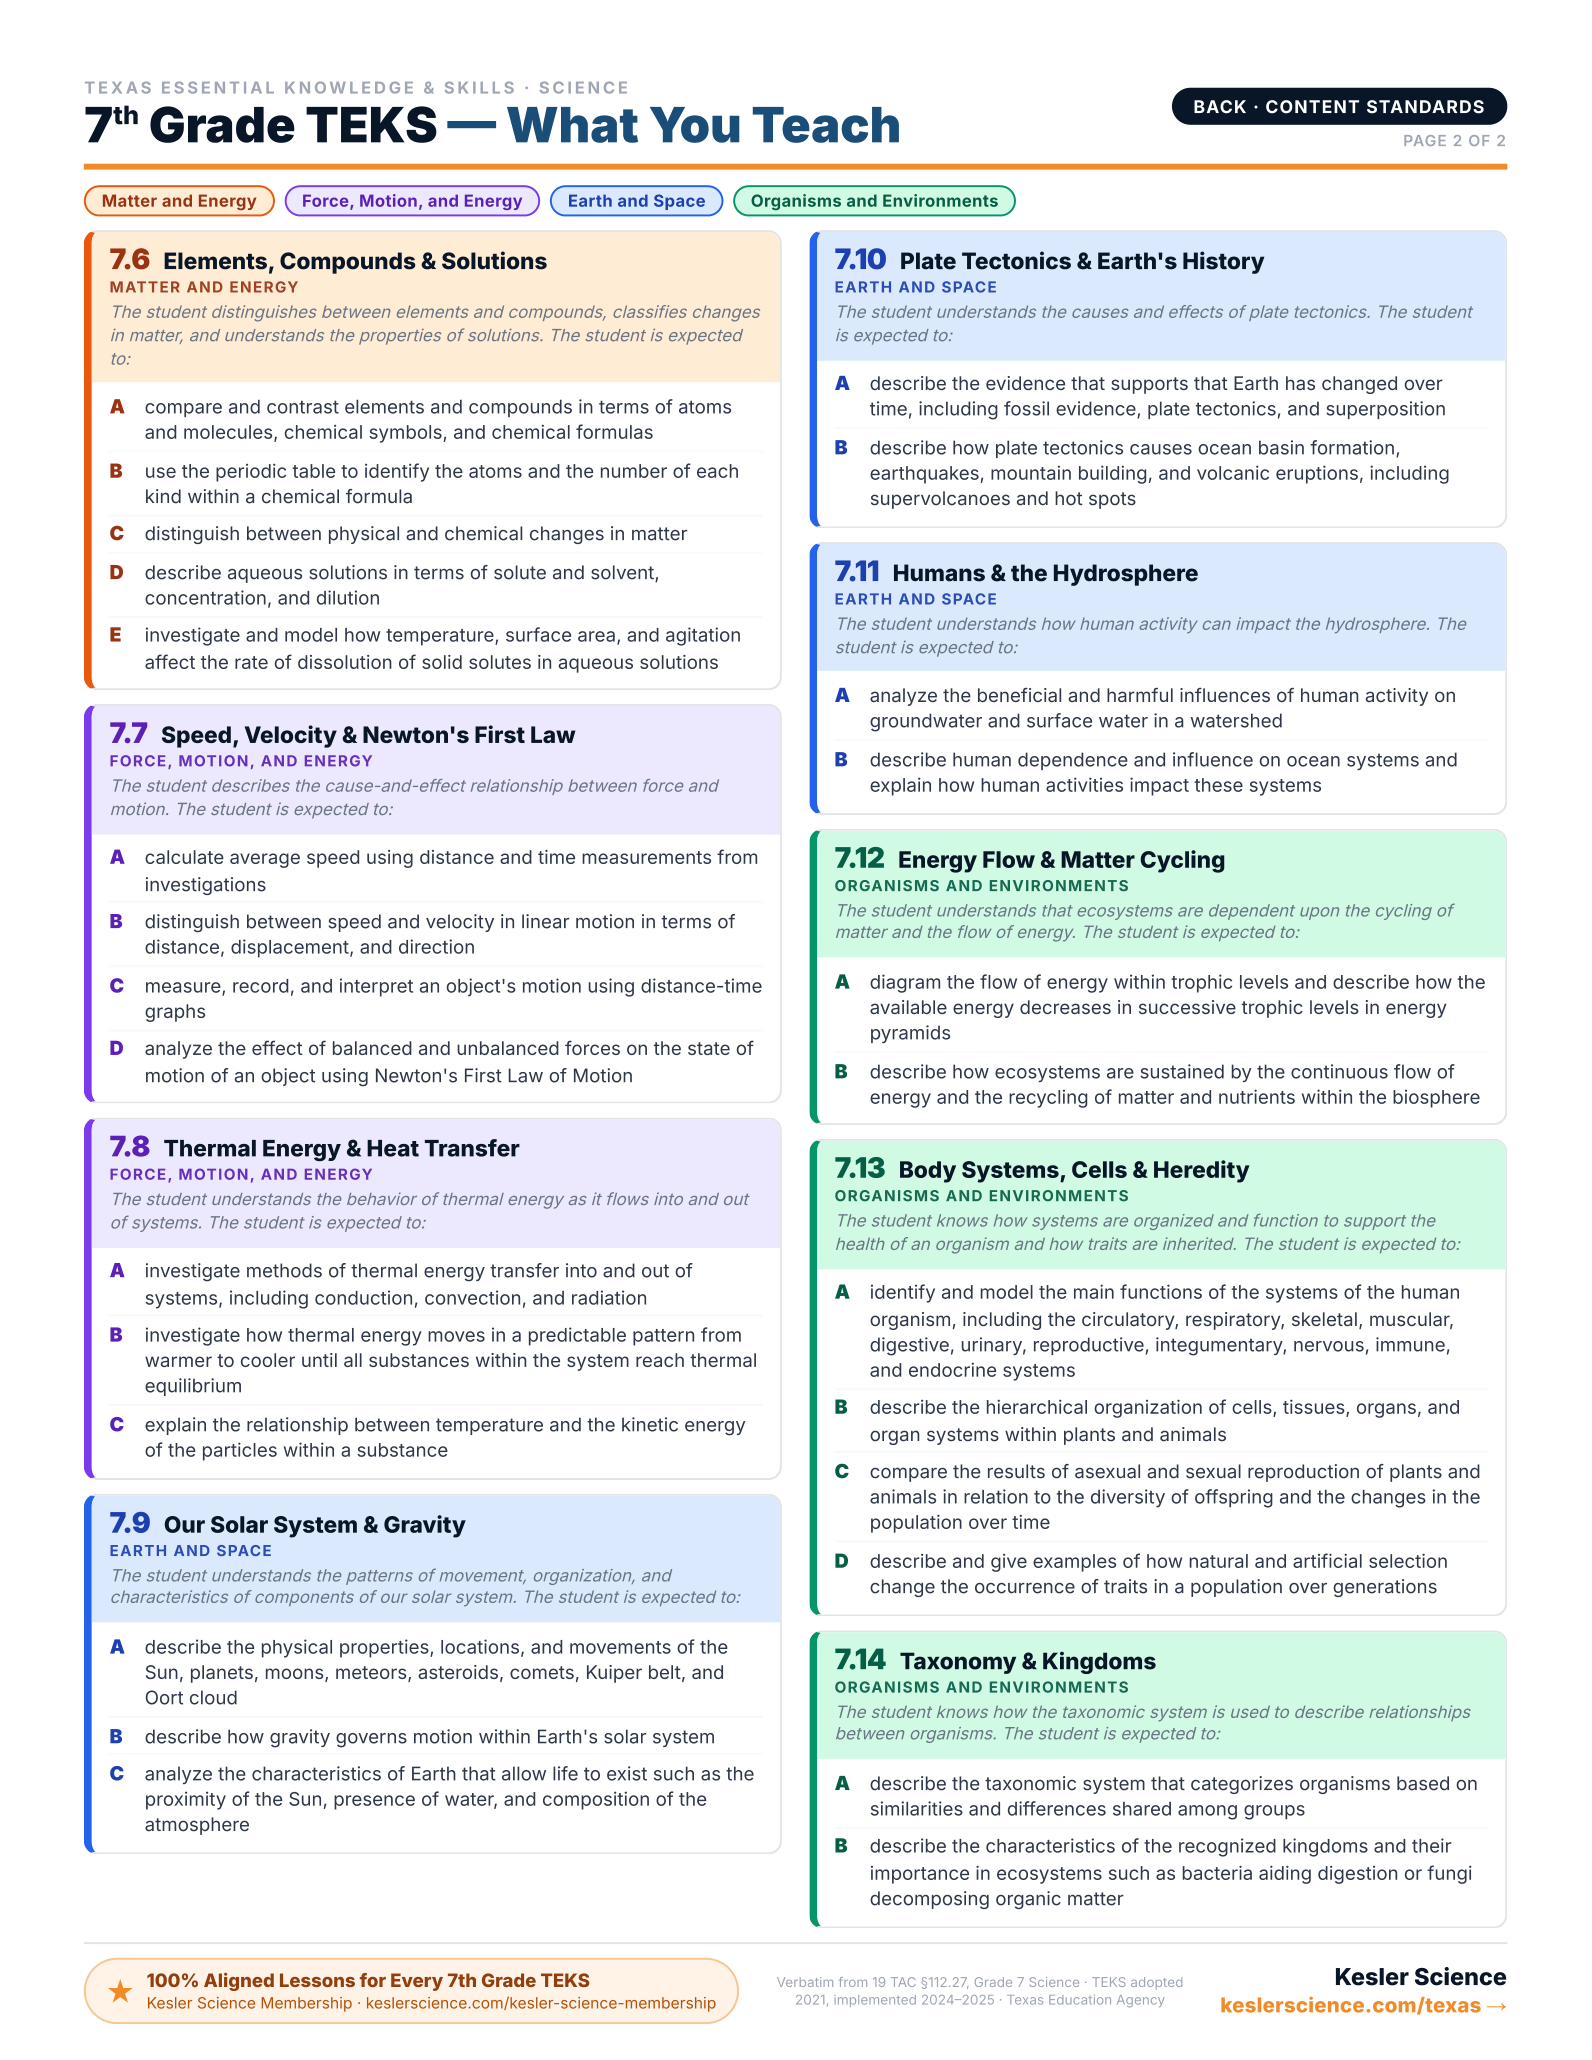
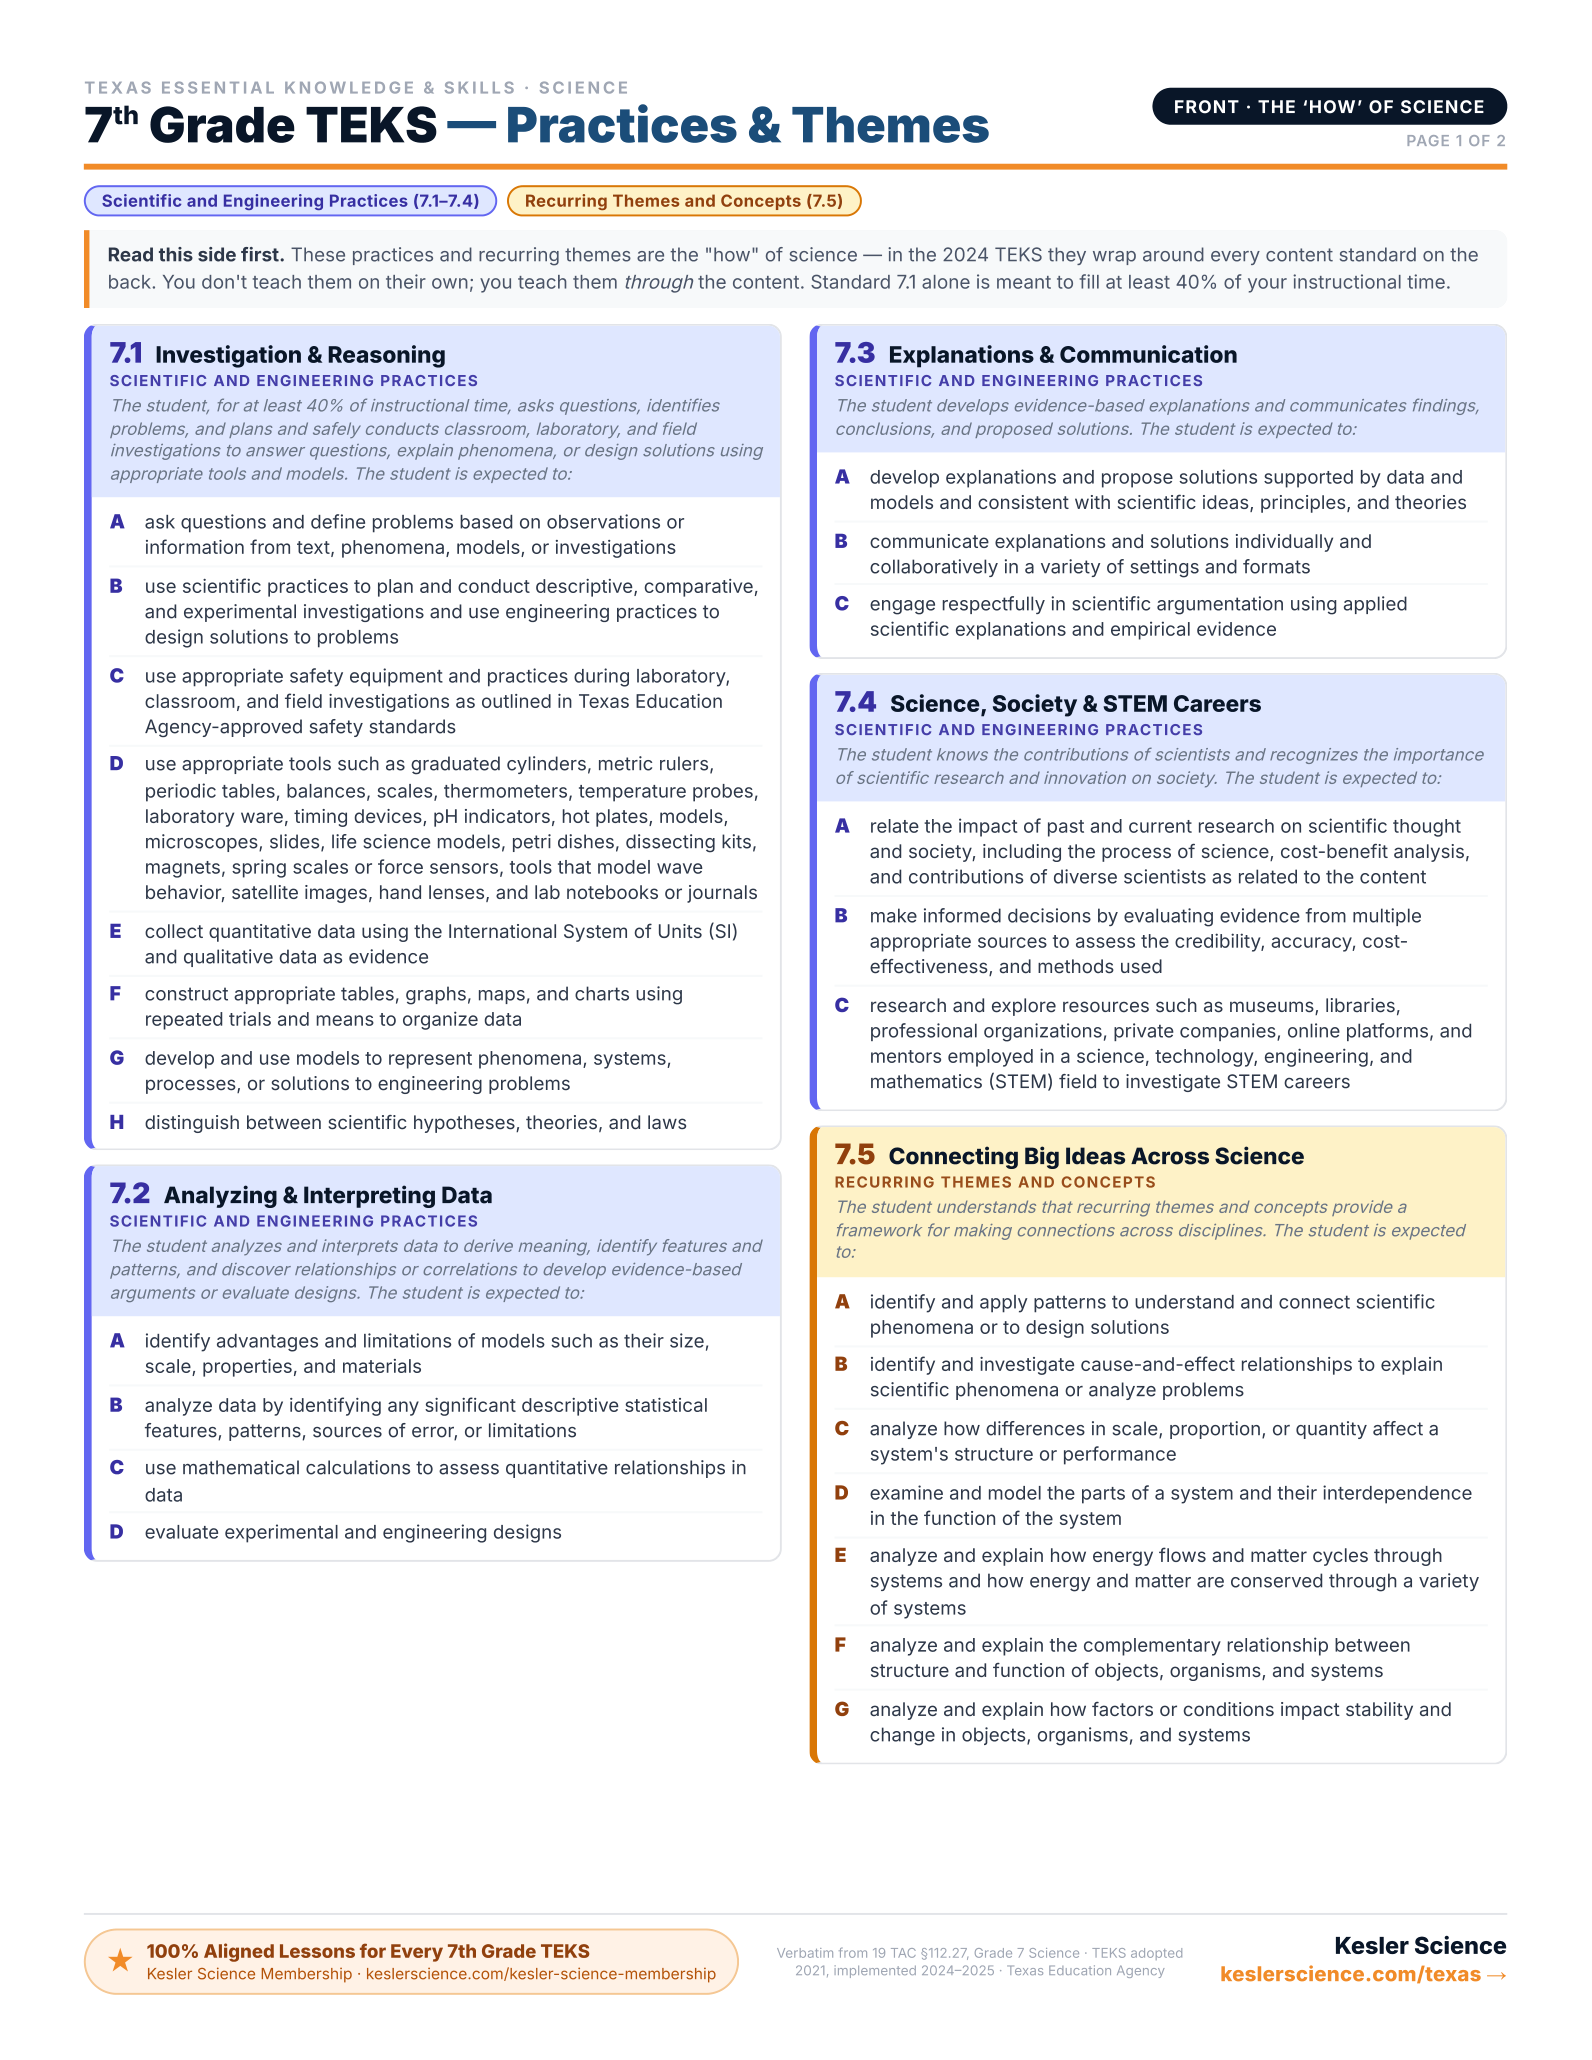
7th Grade TEKS Standards
Click any standard to see what it means, how to teach it, where students get stuck, and aligned resources.
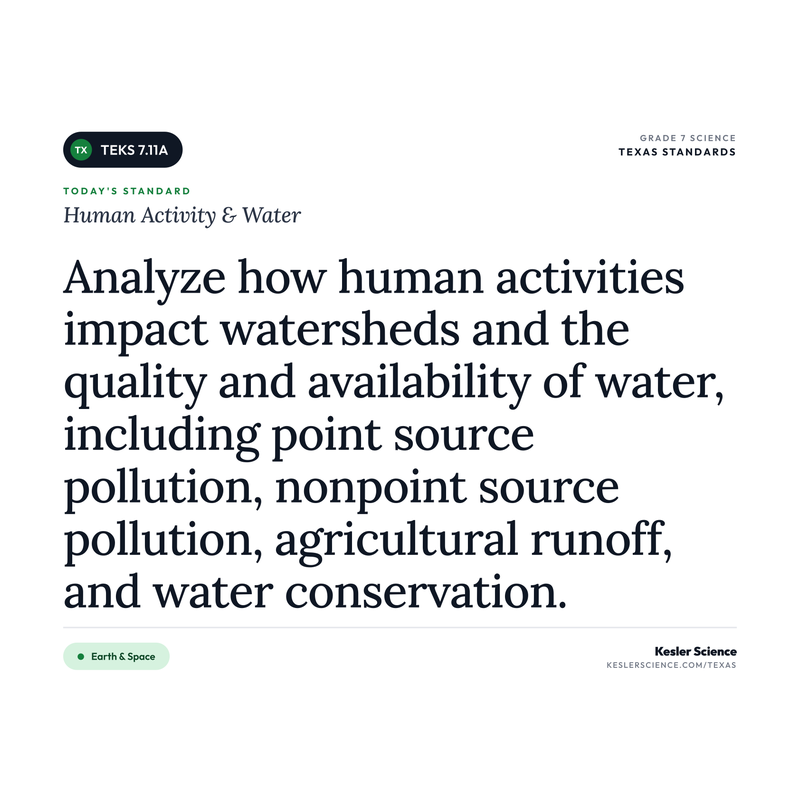
Human Activity & Water
"Analyze the beneficial and harmful influences of human activity on groundwater and surface water in a watershed."
💡 What This Standard Actually Means
"Analyze". Students are analyzing both the beneficial and harmful influences of human activity on groundwater and surface water in a watershed. The new wording is broader than the old version, which focused on specific kinds of pollution. Now kids need to weigh both sides (positive and negative) and consider both groundwater (under the surface) and surface water (rivers, lakes, streams) within a single watershed. Instruction can take many forms, such as watershed mapping projects, beneficial-and-harmful sorting activities, local water-source case studies, and groundwater-vs-surface-water comparison labs.
A watershed is the entire land area that drains into a single river, lake, or aquifer. Every drop of water that falls inside the watershed eventually ends up in the same place. What humans do on that land affects what ends up in the water, both above ground and below. The 2024 standard splits water into two categories students need to think about: surface water (rivers, lakes, streams, ponds, reservoirs) and groundwater (water that soaks down through the soil and collects in underground aquifers).
Students need to analyze both beneficial and harmful influences of human activity on these systems. On the harmful side, factories and treatment plants can release pollutants directly into rivers from a single pipe, and farms, yards, and streets can lose fertilizer, pesticides, and oil to runoff that washes into streams from all over the watershed. Cities have parking lots and roads where oil drips and trash collects, and the next rain carries everything into storm drains and out to natural waterways. Septic systems and leaking underground tanks can contaminate groundwater. Overpumping aquifers can drain them faster than rain refills them.
The beneficial side is just as real and often gets skipped. Wastewater treatment plants clean sewage before returning the water to rivers. Farmers using cover crops, terracing, and reduced fertilizer protect the watershed. Cities install rain gardens and permeable pavement that filter runoff before it reaches streams. Conservation easements protect the land around important rivers and recharge zones for aquifers. Reforestation along stream banks reduces erosion and filters runoff. The big idea students should walk away with is that human activity shapes water quality both ways, and being able to analyze a real situation means weighing the positives against the negatives, not just listing what's wrong.
The move that worked for me on this one was building a cheap watershed model out of a crumpled piece of butcher paper and washable markers, with a sponge tucked underneath to stand in for the groundwater. I'd have kids mark the land: some harmful features (a feedlot, a parking lot, a factory) and some beneficial ones (a strip of trees along the river, a retention pond, a water-treatment plant). Then we'd spray it with a water bottle and watch. The colors from the feedlot and parking lot bled straight down into the river and soaked into the sponge below, while the strip of trees caught and slowed the runoff before it got there. Every year, students would stare at that model and realize two things at once: what people do on the land shows up in the river and in the water underneath it, and human choices can protect that water just as easily as they can pollute it. Don't skip the model just because it feels simple. The concept is actually hard without it.
⚠️ Misconceptions Your Students May Have
These are some of the most common misconceptions. Knowing what to look for can help you get ahead of them.
"Pollution is only a problem when you can see it in the water"
Visible pollution like trash and oil sheens are obvious signs, but many of the most damaging pollutants are invisible. Dissolved fertilizer, pesticides, heavy metals, and bacteria can all be in water that looks clear. The damage shows up downstream in fish kills, algal blooms, and drinking water problems. Clear water doesn't mean clean water.
"Water pollution only comes from factories"
A discharge from a single factory pipe is one important source, but in many watersheds the bigger problem is the pollution that washes off the land from many places at once: the runoff from yards, parking lots, farms, and streets that collects pesticides, oil, fertilizer, and sediment every time it rains. Each contribution feels tiny, but they add up across a whole watershed.
"Extra fertilizer is good because it feeds plants in the river too"
Fertilizer does make things grow, which is the problem. Excess nitrogen and phosphorus cause algae to bloom in huge populations. When the algae die, bacteria decomposing them use up the oxygen in the water. Fish and other aquatic animals suffocate. That process is called eutrophication, and it's responsible for dead zones like the one in the Gulf of Mexico.
"Taking shorter showers is all there is to water conservation"
Household water use matters, but most freshwater consumption in the United States goes to agriculture and industry. Fixing leaky pipes, improving irrigation systems, planting drought-tolerant landscaping, and reducing water-intensive food choices often have larger effects than a shorter shower. Students should see conservation as a system-wide set of choices, not just a personal habit.
📓 Teaching Resources for 7.11A
These resources are aligned to this standard.


100% Aligned Lessons for Every TEKS You Teach
Kesler Science Plus puts thousands of ready-to-teach lessons and activities in your hands, so you can boost engagement and get your planning time back. Trusted by schools and districts all over the great state of Texas.
🌎 Phenomenon Ideas for 7.11A
Use these real-world phenomena to anchor your lesson. Show students the phenomenon first, let them wonder, then build toward Human Activity & Water as the explanation.
The Gulf of Mexico Dead Zone
Every summer, a region of the Gulf of Mexico near the mouth of the Mississippi River becomes a "dead zone" where oxygen levels drop so low that fish, shrimp, and crabs either flee or die. The zone can cover thousands of square miles. Scientists have traced the cause back to fertilizer runoff from farms across more than 30 states along the Mississippi watershed. The nutrients fuel massive algae blooms that, once they die, pull oxygen out of the water as they decompose.
"Fertilizer is put on fields hundreds or thousands of miles from the Gulf. How does something applied in Iowa or Ohio end up affecting fish in Louisiana?"
A Parking Lot After a Summer Storm
After a hard rain, the water rolling off a big-box store parking lot often has a visible rainbow sheen on top. That's oil, antifreeze, brake dust, and gasoline from hundreds of cars, now lifted off the pavement and heading toward a storm drain. Most storm drains in Texas lead directly to creeks and rivers with no treatment. Multiply that one parking lot by every parking lot in the city.
"No single car dripped much oil on that parking lot. So where did all of that pollution come from, and why is it so hard to point at a single person or company as the source?"
Lake Meredith, Texas, Drops Every Year
Lake Meredith in the Texas Panhandle was built in the 1960s as a major water source for Amarillo and other cities. Over decades, the lake's water level dropped dramatically because of drought, evaporation, and water drawn from the surrounding Ogallala Aquifer for farms. The underlying aquifer is also being drained faster than rainfall can refill it. Scientists call this kind of water "fossil water" because once it's gone, it won't come back in our lifetimes.
"If groundwater refills far more slowly than we pump it out, what does that mean for farming and drinking water in the region over the next 50 years? What choices would need to change?"
💡 Free Engagement Ideas for 7.11A
Crumpled Paper Watershed
Crumple a piece of butcher paper or a paper grocery bag, then gently uncrumple it so the peaks and valleys remain. Students use washable markers to draw a farm, a neighborhood, a parking lot, and a factory in different zones. Mist the "landscape" with a water bottle and watch colors bleed downhill into a common stream. It shows how pollution from a single pipe and pollution washing off the whole landscape both end up in the same stream, in 15 minutes.
Helps or Harms the Water? Card Sort
Make index cards with real-world scenarios, some harmful ("a factory dumps waste into a river," "fertilizer washes off a soccer field," "a sewage plant has a broken pipe") and some beneficial ("a town plants a strip of trees along a creek," "a neighborhood adds a rain garden that soaks up runoff," "a farm fences cattle out of the stream"). Students sort each card into "helps the water" or "harms the water," then label whether it affects surface water, groundwater, or both. This puts the beneficial and harmful human influences the standard asks for side by side.
Algae in a Jar
Fill two mason jars with pond water or tap water plus a pinch of soil. Add a small amount of liquid plant fertilizer to one jar and nothing to the other. Cap both jars and place in sunlight for a week. The fertilizer jar typically turns visibly greener as algae bloom. Students connect excess nutrients to eutrophication right in front of them.
Home Water Audit
Send students home with a one-page data sheet. Over 24 hours they track how many times the sink runs, the length of showers, toilet flushes, and any visible outdoor watering. They return with totals and calculate their household's approximate daily water use using standard gallons-per-action numbers. Groups then brainstorm three realistic conservation changes based on their own data.
🎯 What Approaches, Meets, and Masters Thinking Look Like
Here is what student thinking at each level looks like on this one task, so you know what to look for and how to move a student up.
A town sits in a watershed (all the land that drains into the same river). Upstream there are farms, and the river runs past the town to a lake people swim in. After heavy rain, the river looks clear, but a test shows high amounts of fertilizer in the water. Analyze this situation. Name one harmful human influence and one beneficial human influence on the water, and explain how each one affects the river or the lake.
- One clear harmful influence named (for example, fertilizer washing off the farms into the river).
- One clear beneficial influence named (for example, farmers using less fertilizer, planting cover crops, or a treatment plant cleaning the water).
- An explanation of how the harmful influence reaches the water, not just that it is bad: rain carries the fertilizer off the land and into the river (runoff).
- An explanation of how the beneficial influence protects the water, not just that it is good.
- A connection from the river down to the lake, showing the student knows everything in a watershed drains to the same place.
- Recognition that the water can be polluted even when it looks clear, because the fertilizer is dissolved and invisible.
- Both sides weighed in the same answer (harmful and beneficial), since the verb is analyze, not just list problems.
A harmful thing is trash and dirty water from people. A good thing is people cleaning up the trash. But the river is clear in this one, so the water is really fine now. The fertilizer test does not matter that much because you cannot see it, so it is probably not hurting the lake.
A harmful influence is fertilizer from the farms. When it rains hard, the rain washes the fertilizer off the fields and into the river. That is called runoff. The water can still look clear because the fertilizer is dissolved, so you cannot see it. Since the river drains into the lake, the fertilizer ends up in the lake too.
A beneficial influence is the farmers using less fertilizer or planting cover crops to hold the soil. That means less fertilizer washes into the river, so the water stays cleaner for the town and the lake.
The harmful influence is fertilizer runoff from the farms. Heavy rain carries the dissolved fertilizer off the fields into the river, so the water can look clear and still be polluted. The fertilizer makes algae grow really fast in the lake. When all that algae dies and rots, it uses up the oxygen in the water, and then fish can suffocate. So one choice on the land upstream changes the living things in the lake downstream.
The beneficial influence is the farmers planting cover crops and cutting back on fertilizer, which keeps it out of the runoff in the first place.
The same idea works for a city, not just farms. A parking lot is a hard surface, so rain cannot soak in. The water rushes across it and picks up oil and trash, then flows into a storm drain that empties into the same kind of river. A rain garden next to the lot would let the water soak in and filter first. It is the same watershed rule: whatever we put on the land, the rain carries to the water.
Every 7th-Grade Science TEKS on One Page
The color-coded, front-and-back cheat sheet I wish I'd had — every standard, organized by reporting category. Print it and reference it all year long. This will be your new favorite document!
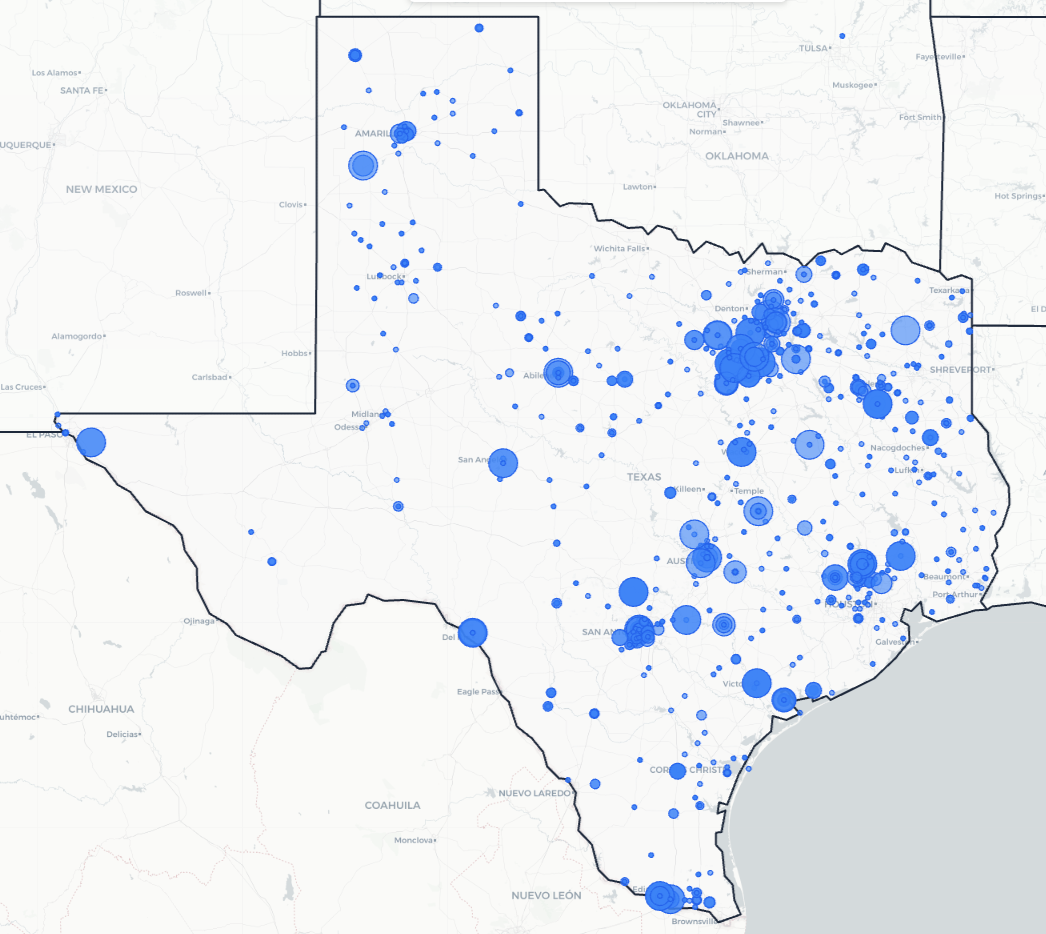
Trusted Across Texas
From the Rio Grande Valley to the Panhandle, Texas science teachers are using Kesler Science to save time and engage students.
Texas Schools and Districts
Love Kesler Science
What Teachers Are Saying
Give Your Science Teachers Everything They Need
School and district licenses give your teachers access to every resource they need, including station labs, inquiry labs, anchoring phenomena, presentations, escape rooms, and much more. One purchase covers the grade levels you need.
- PO-friendly. We accept purchase orders
- Volume discounts for 11+ teachers
- Complimentary Kesler Science Plus orientation for 4+ teachers
- Three free implementation PD sessions for departments of 11+
- Aligned to the 2024 TEKS standards
See It in Action
Book a walkthrough and we'll show you how Kesler Science fits your campus.
Book Demo CallNo pressure, no hard sell