.png?width=375&height=100&name=WebPage%20logo%20with%20curves%202026%20(8).png)
Texas Science Teacher Resource Hub
Free scope and sequences, TEKS breakdowns, phenomenon ideas, and engagement activities for the 2024 Texas science standards.

🚀 Jump to Your Grade
Pick your grade level and go straight to your TEKS standards, aligned resources, and teaching tools.
-
4th
→4th Grade Science20 standards • Matter, Earth, Energy & more
-
5th
→5th Grade Science19 standards • Matter, Ecosystems, Space & more
-
6th
→6th Grade Science24 standards • Forces, Energy, Matter & more
-
7th
→7th Grade Science27 standards • Cells, Chemistry, Earth & more
-
8th
→8th Grade Science24 standards • Newton's Laws, Space, Genetics & more
7th Grade TEKS Standards
Click any standard to see what it means, how to teach it, where students get stuck, and aligned resources.
Diagram Trophic Levels
"Diagram the flow of energy within trophic levels and describe how the available energy decreases in successive trophic levels in energy pyramids."
💡 What This Standard Actually Means
"Diagram". Students are diagramming the flow of energy within trophic levels and describing how the available energy decreases in successive levels in energy pyramids. The new TEKS pushes the focus to trophic levels and energy pyramids specifically, instead of the broader "food chains, food webs, and energy pyramids" wording from the old standard. Kids need to understand the layered structure of an energy pyramid and the 10 percent rule that drives it. Instruction can take many forms, such as energy pyramid drawing activities, paper-folding 10-percent demonstrations, trophic level card sorts, and ecosystem case study analysis.
Energy in an ecosystem flows in one direction. It starts with the Sun, gets captured by producers (plants and algae using photosynthesis), and moves up from there through a series of trophic levels. A trophic level is just a layer in the energy pyramid based on how an organism gets its food.
The first trophic level is producers. The second is primary consumers, which are herbivores that eat producers. The third is secondary consumers, which eat primary consumers. The fourth is tertiary consumers, which eat secondary consumers. Decomposers recycle matter and energy from every level back into the system, but they're usually drawn off to the side rather than as their own numbered level. Each step up the pyramid contains less total available energy than the level below.
The reason for the decrease is the famous 10 percent rule. Roughly 10 percent of the energy at one trophic level transfers to the next. The other 90 percent gets used by the organism for life processes (moving, breathing, growing, repairing tissue, staying warm) and is mostly lost as heat to the surroundings. So if producers in an ecosystem capture 10,000 units of energy from the Sun, primary consumers get about 1,000 units, secondary consumers get about 100, and tertiary consumers get about 10. That's why energy pyramids have such a wide base and a tiny top, and why ecosystems have many more producers and herbivores than they do top predators. When students diagram this, they should show layered levels with decreasing energy at each step and arrows that flow upward (from the eaten to the eater).
The move that worked for me on this one was arrows, arrows, arrows. I'd have kids draw a food chain on the board, then I'd walk up and ask, "Which way is the energy flowing?" Half the room would have drawn the arrows pointing from the predator to the prey, which is backward. We'd talk through why the arrow means "energy goes this way" and the energy goes into whoever's doing the eating. Then I'd have them redraw. After that, I'd give them a stack of organism cards from a Texas ecosystem and let them build a full web on butcher paper using yarn for arrows. The minute you could pull one "string" and see how the whole thing wobbled, they got why ecosystems are connected.
⚠️ Misconceptions Your Students May Have
These are some of the most common misconceptions. Knowing what to look for can help you get ahead of them.
"The arrow in a food chain points from the predator to the prey"
The arrow shows the direction energy flows, which is from the organism being eaten to the organism doing the eating. So grass-to-grasshopper means energy flows from grass into the grasshopper. Students who draw it the other way are thinking "who hunts whom," but the standard is about energy, not predation. Walk them through it on one chain and the rest of the unit gets easier.
"Exactly 10 percent of the energy transfers to the next level"
The 10 percent rule is an approximation, not an exact number. In real ecosystems, energy transfer between trophic levels typically ranges from about 5 to 20 percent depending on the organisms and conditions. The takeaway students need is that MOST of the energy is lost at each step (as heat, movement, and life processes), so higher trophic levels have far less energy available to them. "About 10 percent" is the safe phrasing.
"Decomposers are their own trophic level at the top of the pyramid"
Decomposers don't sit at a single level because they recycle dead material from every level. A decomposer might break down a fallen leaf one day and a dead hawk the next. That's why you'll often see decomposers drawn off to the side of a food web or energy pyramid rather than stacked above the top predators. They're essential, but they don't fit the linear pyramid structure neatly.
"Plants eat dirt to get their food"
Plants are producers. They make their own food from sunlight, carbon dioxide from the air, and water through photosynthesis. Soil provides water and minerals the plant needs, but the actual energy source is sunlight. Students who think plants "eat" dirt have a hard time seeing why producers sit at the base of every food chain, because they don't recognize photosynthesis as food-making.
📓 Teaching Resources for 7.12A
These resources are aligned to this standard.


100% Aligned Lessons for Every TEKS You Teach
Kesler Science Plus puts thousands of ready-to-teach lessons and activities in your hands, so you can boost engagement and get your planning time back. Trusted by schools and districts all over the great state of Texas.
🌎 Phenomenon Ideas for 7.12A
Use these real-world phenomena to anchor your lesson. Show students the phenomenon first, let them wonder, then build toward Diagram Trophic Levels as the explanation.
Wolves Change the Rivers in Yellowstone
After gray wolves were reintroduced to Yellowstone National Park in 1995, something unexpected happened. Elk populations dropped, which allowed willow and aspen trees to recover along streams. Beavers returned because they had willows to chew. In some areas, beavers helped stabilize stream banks as willows recovered. (Scientists are still debating how much of this cascade can be attributed directly to the wolves.) A single change at the top of the food web rippled down to plants and the physical landscape.
"If wolves only directly eat animals like elk, how could adding wolves back to Yellowstone end up affecting trees, beavers, and even the shape of rivers?"
Why Are There So Few Eagles Compared to Grasshoppers?
In a Texas grassland, a single square mile might support millions of blades of grass, hundreds of thousands of grasshoppers, a couple thousand mice, maybe a hundred snakes, and only a few hawks or eagles. Every step up the food chain has dramatically fewer individuals than the one below. This pattern shows up in almost every ecosystem on Earth, from coral reefs to tundras.
"Why can an ecosystem support millions of producers, but only a few top predators? What is being lost at each step that limits how much life can exist higher up?"
A Fallen Log in the Texas Woods
A big post oak dies and falls in a Texas forest. At first the log looks mostly intact. Two years later, it's crumbling. Five years later, it's mostly gone, with mushrooms growing out of the remains and the surrounding soil noticeably darker. No single animal "ate" that tree, but all of its material got recycled back into the ecosystem and new plants are growing in the soil where it lay.
"If no single animal ate that log, where did all of its material go? What role are fungi, bacteria, and other decomposers playing in returning that energy and matter back into the ecosystem?"
💡 Free Engagement Ideas for 7.12A
Trophic Level Lineup
Tape four big paper signs across one wall: Producer, Primary Consumer, Secondary Consumer, Tertiary Consumer. Hand each student a card with one Texas organism on it (bluebonnet, grasshopper, field mouse, hawk, oak tree, deer, mountain lion, etc.). Students walk to the sign that matches their organism's trophic level and line up. Then count how many students stand in each level. The base of the room is packed. The top is nearly empty. That is exactly what an energy pyramid looks like and it gives every student a body sense of why energy decreases at every step.
Build the Energy Pyramid
Give each group 111 unit cubes (or pennies, dried beans, or sticky notes). To build the whole pyramid at once, they lay 100 cubes as the producer level, stack 10 on top for primary consumers, then 1 for the secondary consumer (100 + 10 + 1 = 111). Secondary consumers can barely feed a tertiary consumer. Students stack their cubes into a pyramid shape and label each level. The 10 percent rule becomes obvious by the time the top of the pyramid has nothing left to give.
Trophic Level Sorting Challenge
Prepare cards with around 20 organisms from a single ecosystem (oak tree, acorn, deer, squirrel, hawk, owl, field mouse, snake, mushroom, earthworm, soil bacteria, grasshopper, ladybug, spider, etc.). Students sort the cards into five columns: producer, primary consumer, secondary consumer, tertiary consumer, and decomposer. Some organisms (omnivores, decomposers) can spark good debates. Each group justifies their placements out loud, and the class votes on tricky ones.
Decomposer Time-Lapse
Place a banana slice (or a piece of bread) in a clear jar with a small amount of moist soil. Loosely cover the jar so air can flow but moisture stays in. Set it on a windowsill and have students take a daily photo and write a short observation for two weeks. By day 14, mold and bacteria are visible, the food is breaking down, and students can connect what they see to the role decomposers play in returning matter to the soil. Discuss why an ecosystem without decomposers would pile up with dead organisms forever.
🎯 What Approaches, Meets, and Masters Thinking Look Like
Here is what student thinking at each level looks like on this one task, so you know what to look for and how to move a student up.
A grassland food chain has four organisms: grass, grasshoppers, mice, and hawks. Draw an energy pyramid for this food chain. Put each organism on the right level, add arrows to show which way the energy flows, and then explain what happens to the amount of energy as you move up the pyramid.
- A pyramid shape: a wide base for the producers and a narrow top, not a flat list.
- The organisms placed on the correct levels: grass at the bottom (producer), then grasshoppers, then mice, then hawks at the top.
- The word producer used for the grass, because grass makes its own food and is the base of the pyramid.
- A clear statement that there is less available energy at each level going up, with the most energy at the bottom.
- The idea that about 10 percent of the energy moves to the next level, and the rest is used for life processes and lost as heat.
- Arrows that point from the organism being eaten to the organism eating it, because the arrows show which way the energy flows. That is the easiest part to draw backwards.
The grass is on the bottom and the hawk is on top. I drew the arrows from the hawk down to the mouse, then to the grasshopper, then to the grass, because the hawk eats the mouse and the mouse eats the grasshopper. There is less energy at the top.
Grass is the producer at the bottom because it makes its own food from the Sun. The arrows point up because the energy flows from the food into the animal that eats it. The grass gives energy to the grasshopper, the grasshopper to the mouse, and the mouse to the hawk. There is less energy at each level going up. Only about 10 percent of the energy moves to the next level. The rest gets used up by the animal for moving and growing, so the hawk at the top has the least energy.
The arrows point up because they follow the energy, which goes from the food into whatever eats it. The energy gets smaller at each level because only about 10 percent moves up. The other 90 percent is used by the animal for moving, breathing, and growing, and most of it leaves as heat. So if the grass has 10,000 units, the grasshoppers get about 1,000, the mice get about 100, and the hawk gets about 10.
That also explains something I noticed: this grassland has tons of grass and lots of grasshoppers, but only a few hawks. There has to be a huge base of producers because so much energy is lost on the way up. If you added a fifth animal that ate hawks, there would be almost no energy left for it, so the food chain pretty much has to stop near the top.
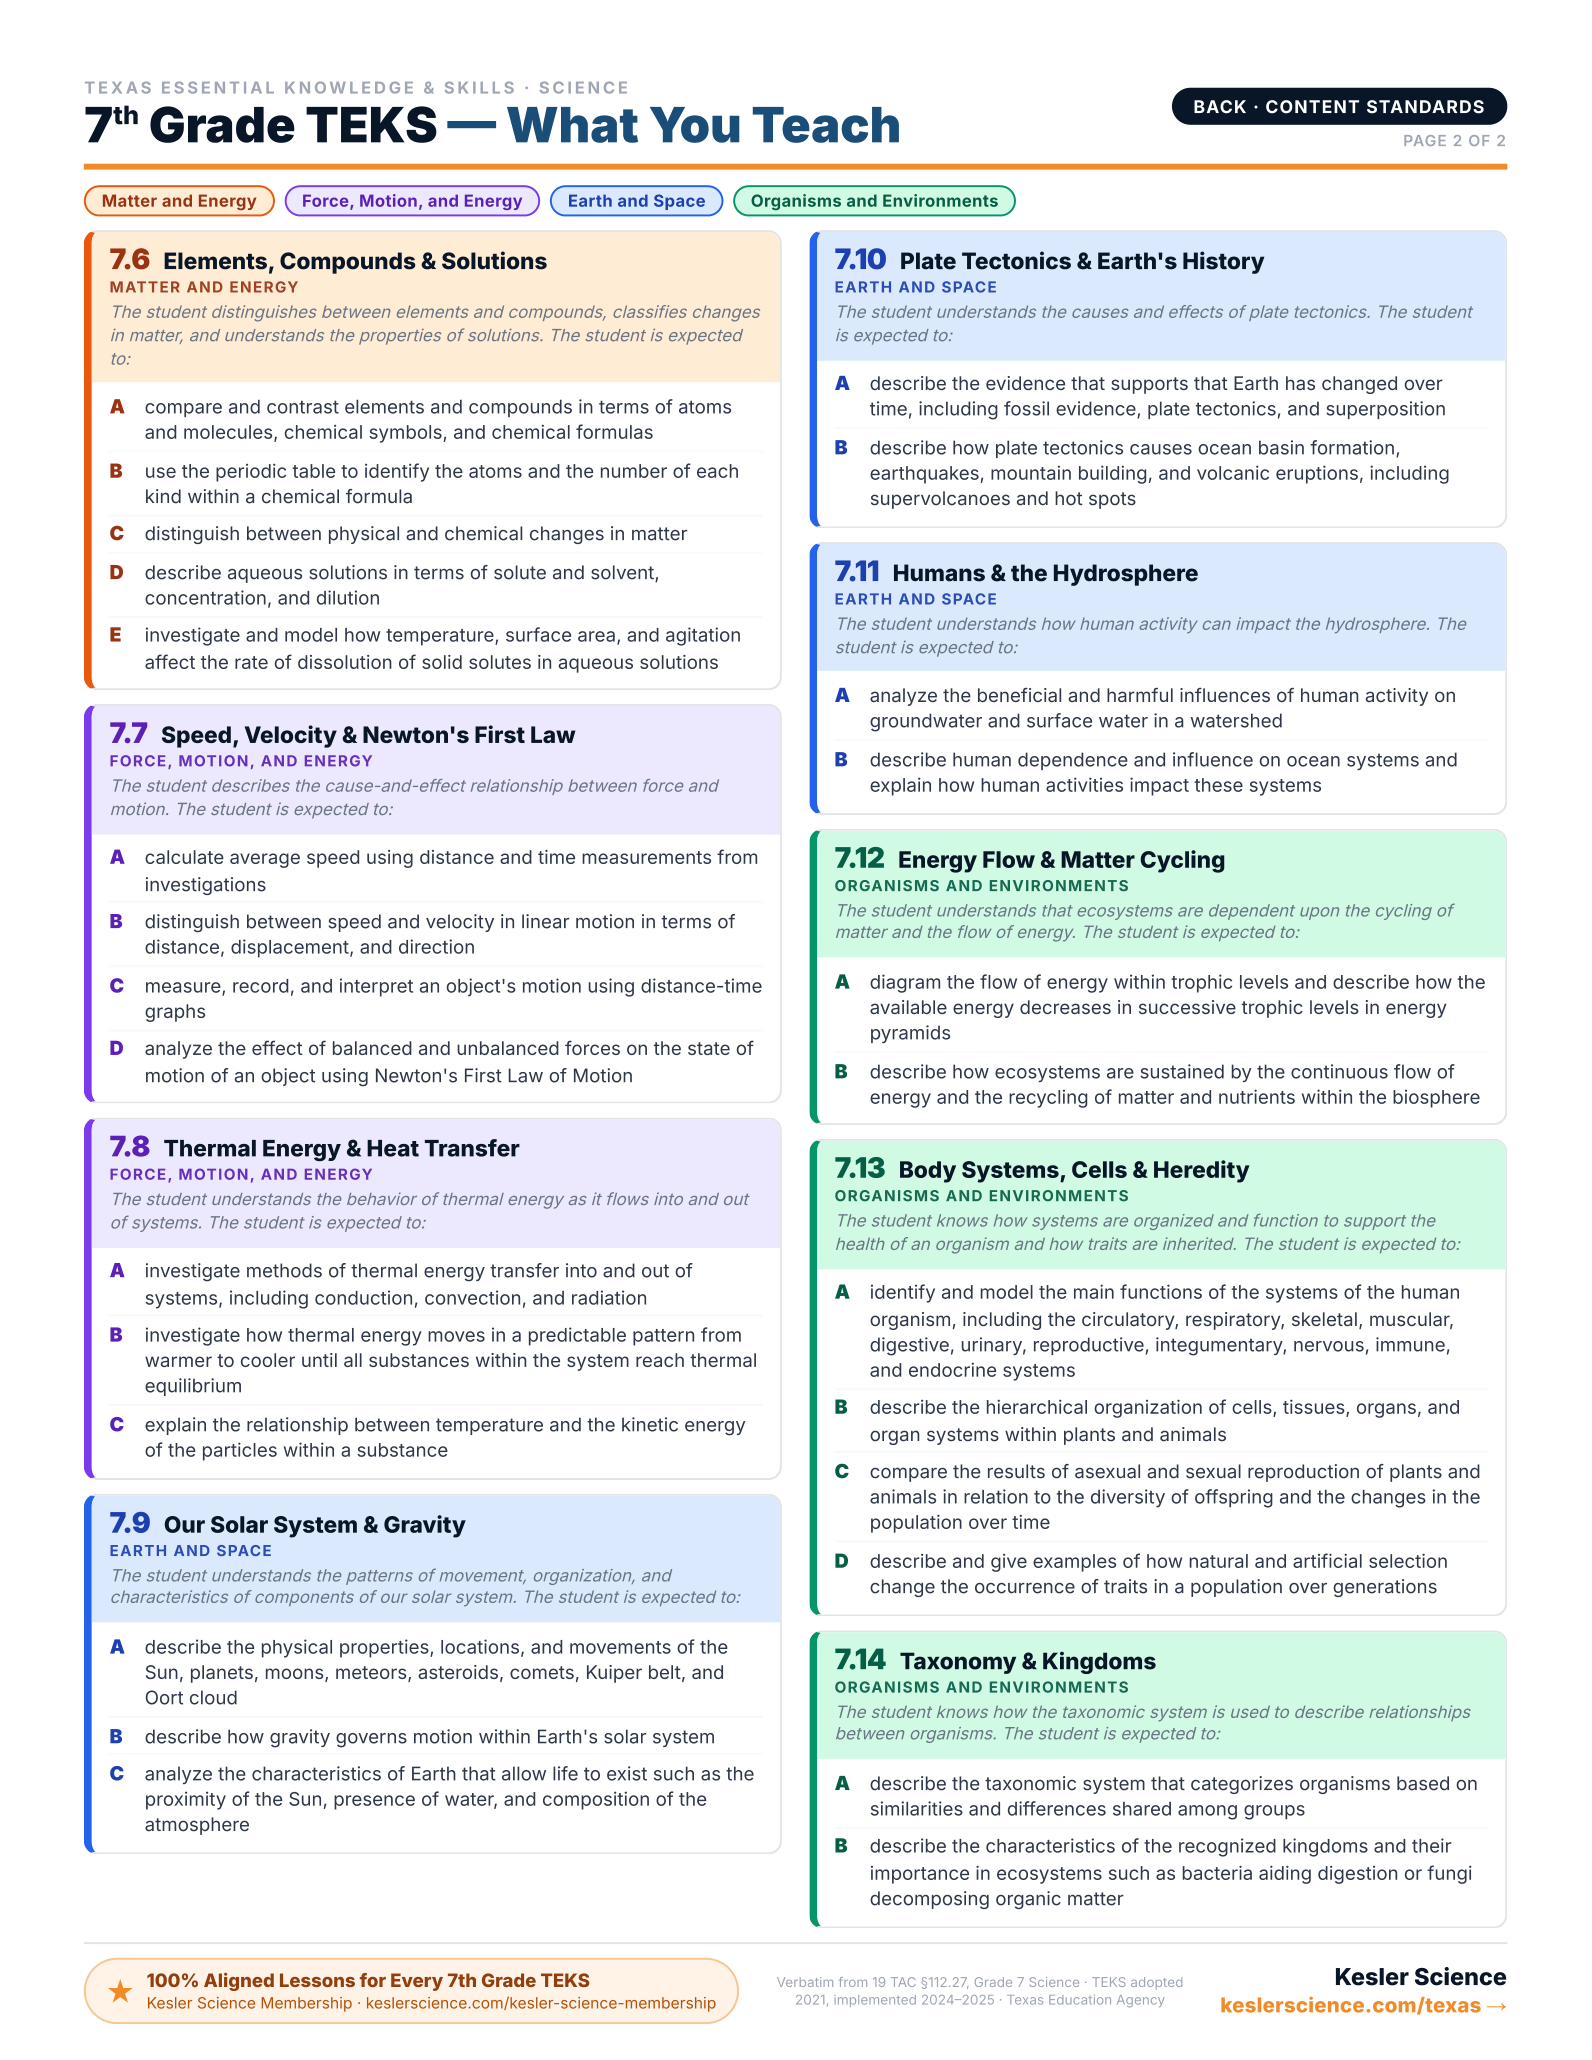
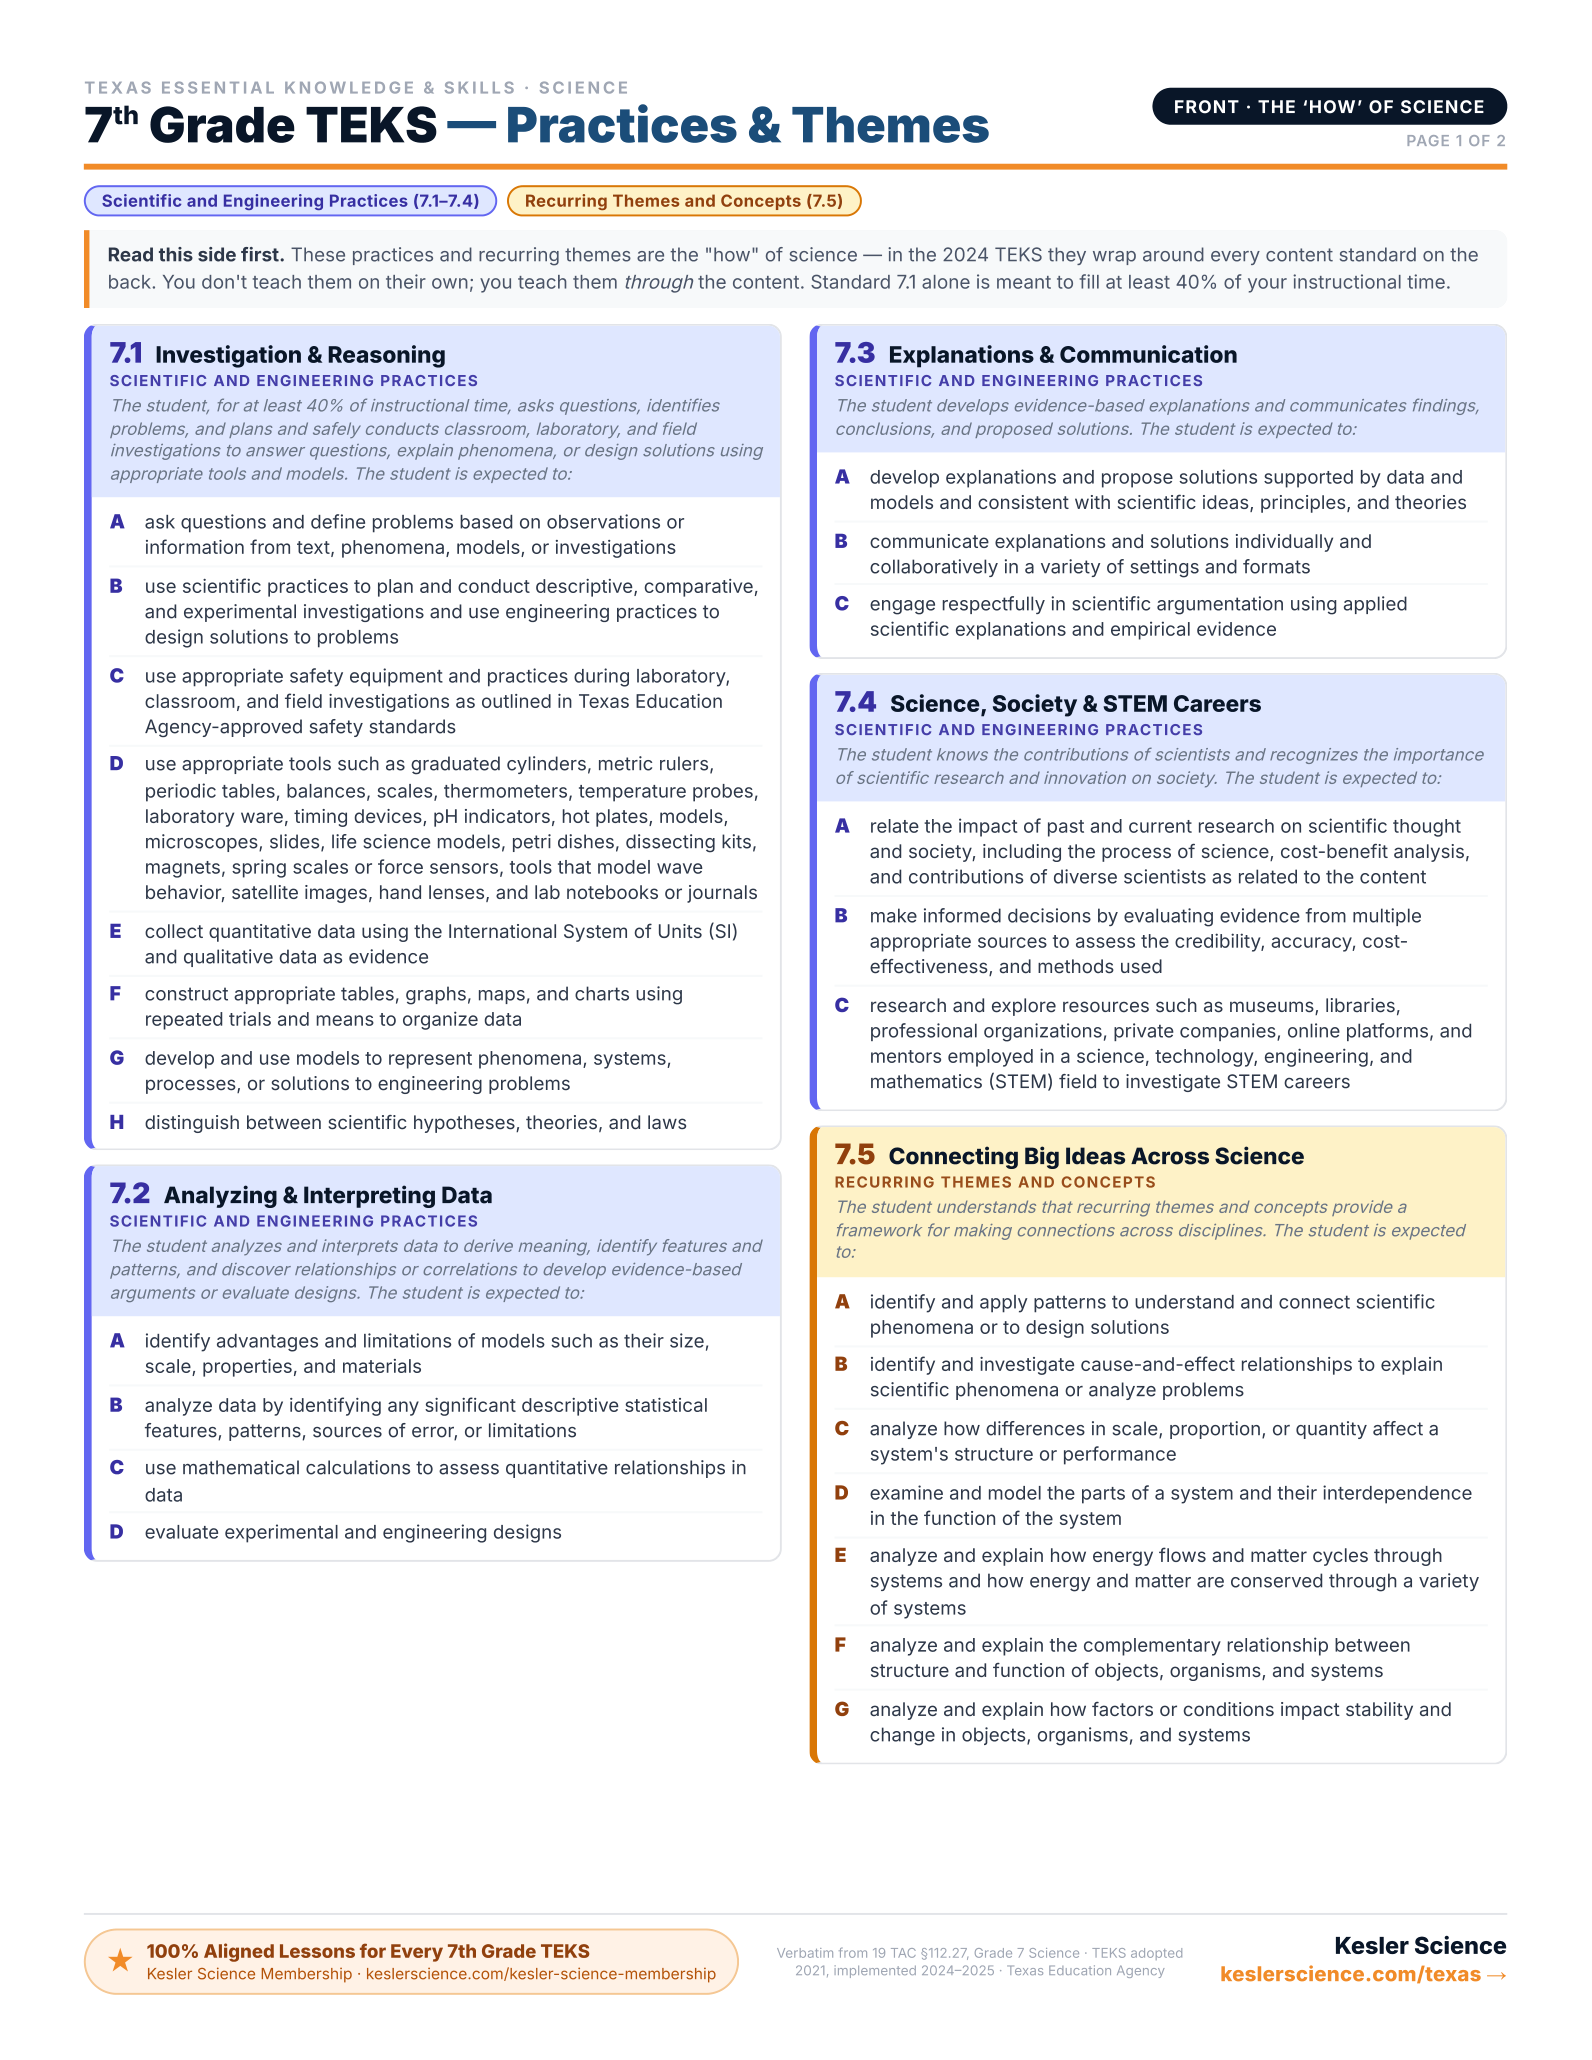
Every 7th-Grade Science TEKS on One Page
The color-coded, front-and-back cheat sheet I wish I'd had — every standard, organized by reporting category. Print it and reference it all year long. This will be your new favorite document!
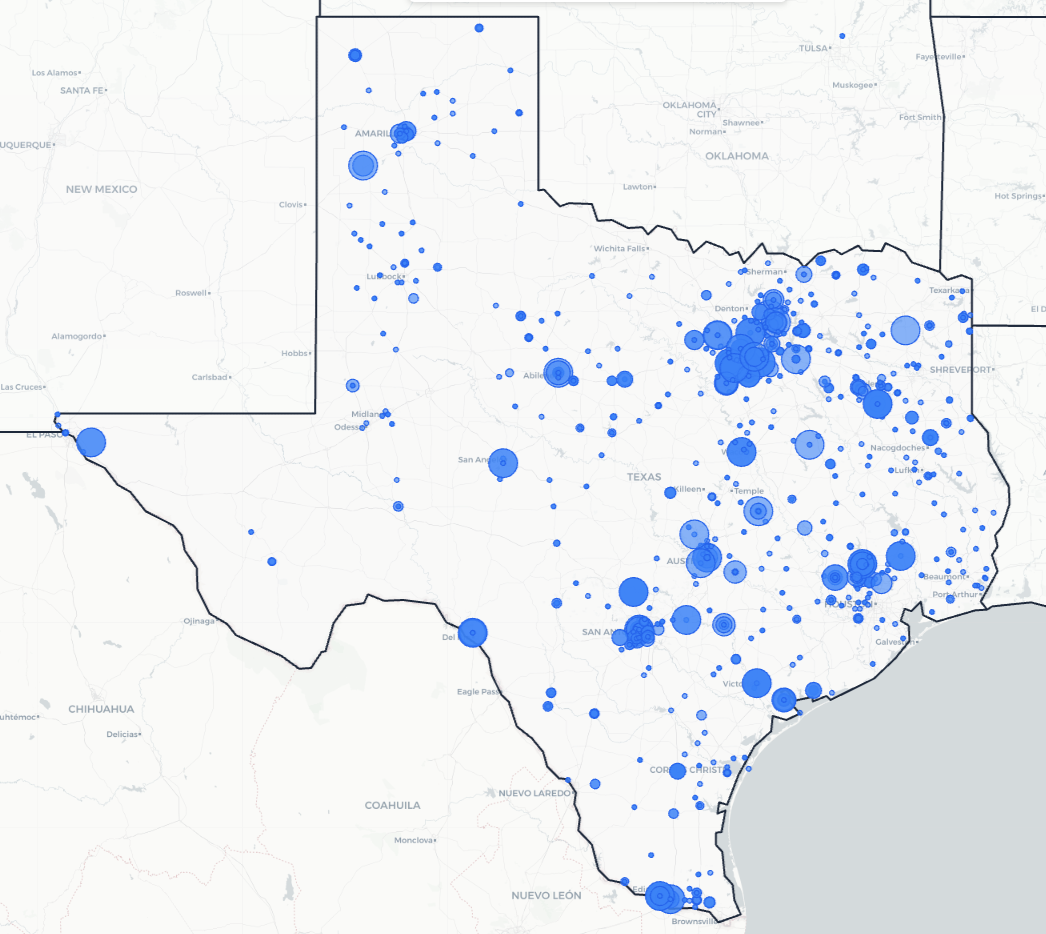
Trusted Across Texas
From the Rio Grande Valley to the Panhandle, Texas science teachers are using Kesler Science to save time and engage students.
Texas Schools and Districts
Love Kesler Science
What Teachers Are Saying
Give Your Science Teachers Everything They Need
School and district licenses give your teachers access to every resource they need, including station labs, inquiry labs, anchoring phenomena, presentations, escape rooms, and much more. One purchase covers the grade levels you need.
- PO-friendly. We accept purchase orders
- Volume discounts for 11+ teachers
- Complimentary Kesler Science Plus orientation for 4+ teachers
- Three free implementation PD sessions for departments of 11+
- Aligned to the 2024 TEKS standards
See It in Action
Book a walkthrough and we'll show you how Kesler Science fits your campus.
Book Demo CallNo pressure, no hard sell