.png?width=375&height=100&name=WebPage%20logo%20with%20curves%202026%20(8).png)
NGSS Resource Hub
Three-dimensional breakdowns, phenomena, and classroom-ready activities for every NGSS standard, grades 4-8.

🚀 Jump to Your Discipline
Middle School NGSS Standards
Pick any standard. Each page is your full lesson-planning workspace for that standard.
Analyzing Design Test Data: Cherry-Picking the Best Features Into a Better Solution
"Analyze data from tests to determine similarities and differences among several design solutions to identify the best characteristics of each that can be combined into a new solution to better meet the criteria for success."
NGSS Lead States. (2013). Next Generation Science Standards: For states, by states (MS-ETS1-3). The National Academies Press. https://www.nextgenscience.org/dci-arrangement/ms-ets1-engineering-design
NGSS does not list an explicit clarification statement for this standard.
NGSS does not list an explicit assessment boundary for this standard.
The three dimensions packed into this standard
Every standard bundles a DCI (the content), a SEP (the science practice), and a CCC (the crosscutting lens). They run in the same task, not in sequence.
"There are systematic processes for evaluating solutions with respect to how well they meet the criteria and constraints of a problem. Sometimes parts of different solutions can be combined to create a solution that is better than any of its predecessors."
National Research Council. (2012). A framework for K-12 science education: Practices, crosscutting concepts, and core ideas. The National Academies Press. https://doi.org/10.17226/13165
"Although one design may not perform the best across all tests, identifying the characteristics of the design that performed the best in each test can provide useful information for the redesign process, that is, some of those characteristics may be incorporated into the new design."
National Research Council. (2012). A framework for K-12 science education. The National Academies Press.
When you test three designs, you rarely get one clear winner. Design A handles load like a champ but costs too much. Design B is cheap but flexes under weight. Design C is light but slow to build. The work isn't picking a winner. The work is reading the data, naming what each one did well, and combining those strengths into a v4 that beats all three.
"Analyze and interpret data to determine similarities and differences in findings."
National Research Council. (2012). A framework for K-12 science education. The National Academies Press.
Students aren't picking favorites or going with gut feel. They're analyzing test data, finding the similarities and differences across designs, and using those patterns to decide what to keep, what to drop, and what to combine. The data drives the redesign, not the prettiest prototype.
"Engineering standards typically do not specify a single CCC."
National Research Council. (2012). A framework for K-12 science education. The National Academies Press.
Patterns show up across the test results. One design fails the same way every trial. Another excels under one condition and tanks under another. Spotting those patterns is what tells you which features are real strengths and which were lucky one-offs. No pattern, no useful redesign.
📍 Where This Standard Fits in the K-12 Progression
Use this to plan the year. Knowing what students should already know and what they're heading toward keeps the lesson focused.
""
Analyzing Design Test Data: Cherry-Picking the Best Features Into a Better Solution
""
🌎 Phenomena for MS-ETS1-3
Anchor the lesson in one puzzling phenomenon kids keep coming back to. Use the two investigative phenomena to sharpen specific facets.
The Hybrid Car That Took Over the Driveway
Two engineers walk into a problem. One has a gas engine that's powerful but burns fuel. One has an electric motor that's clean but runs out of charge fast. Each design solves part of the problem and fails at another part. Then somebody combined them, put a small gas engine and an electric motor in the same car, and the hybrid was born. Same fuel tank, way more miles. Students will see hybrids on the road all week.
"How do engineers decide which parts of two different designs to combine, and how do they know the combination will be better than either one alone?"
- "Why didn't they just pick the better one?"
- "What did they have to give up to make the hybrid work?"
- "Could you keep combining and combining until you got the perfect car?"
The iPhone Was Never Just a Phone
Pull up a picture of a 2006 desk: a flip phone, an iPod, a digital camera, a planner. Then a 2007 iPhone. Same functions, one device. Steve Jobs introduced it as a combination of three products: a widescreen iPod with touch controls, a mobile phone, and an Internet communicator. The iPhone wasn't a brand-new invention. It was a combined solution that pulled the best features from several products into one design. Use this one to sharpen the lens the anchor is pushing on: combining beats inventing from scratch.
"When engineers combined the features of several products into one, what trade-offs did they have to make for it to work?"
- "If it was just combining stuff, why didn't anyone do it sooner?"
- "What got worse when they combined? The camera? The battery?"
- "Are there things on my phone that still don't work as well as the standalone version?"
Three Backpacks, One Better Backpack
A student tested three backpacks on the way to school. One had great straps but a tiny main pocket. One held everything but the zipper broke in a week. One was waterproof but heavy. None was great. The student sketched a v4 combining the straps from Bag 1, the layout from Bag 2, and the waterproofing from Bag 3. Same kind of design analysis the anchor demands, only with something every middle schooler has tested in real life.
"How would you decide which features from three so-so backpacks to combine into a v4 worth carrying?"
- "What if combining the features makes it too heavy to wear?"
- "How do I know which criterion matters most? Comfort, capacity, or waterproofing?"
- "Would the combined backpack be cheaper or more expensive to make?"
100% Aligned Lessons for Every NGSS Standard You Teach
The membership gives you access to thousands of lessons and activities designed to boost student engagement and reclaim valuable teaching time. Trusted by schools and districts from every NGSS state.
⚠️ Misconceptions Your Students Will Walk In With
These come up almost every year. Knowing them in advance lets you head them off in the first lesson.
"The best parts of every design will always combine into something better."
Not always. Sometimes two strong features cancel each other out. A super-strong material that's also super-heavy might fail a different criterion. Combining is a hypothesis to test, not a guarantee. The data from the next test tells you whether the combination actually worked.
"More data always gives you more redesign options."
Data quality matters more than data quantity. If you only measured load, you have no way to combine for cost or weight. Pick your criteria before you test, measure those criteria carefully, and the analysis has something to work with. Fifty data points on the wrong variable don't help.
"If my first three designs all failed, the project is a bust."
Three failures full of useful data are a great starting point. Maybe one held weight better, one cost less, one was easier to build. The redesign pulls the best piece from each. Failure isn't the opposite of progress in engineering. It's the data you need to make the next version smarter.
"You should keep testing and redesigning until your solution is perfect."
Engineering runs on constraints. Time, money, materials, deadlines. "Perfect" usually means "too expensive" or "too late." The real goal is a solution that meets the criteria well enough inside the constraints. Once it does, ship it. The standard is "better meet the criteria for success," not "achieve perfection."
🙋 Common Student Questions and How to Respond
These come up almost every time this standard gets taught. Plan a response and you'll keep the lesson focused.
Look closer. Even small differences matter. Maybe one used more tape, one had a wider base, one was built faster. Those count as features. If the designs really are identical, the next move is to add variation on purpose: change one variable per design so the comparison has something to chew on.
It depends on what your data is for. If we're testing it, we build it. If we're using the analysis to propose a v4 on paper, a labeled sketch with a data-backed defense is enough. Either way, the combined design has to be tied to specific evidence from the earlier tests.
That's a real result and worth reporting. Engineers run into this all the time. The strongest material might not pair with the cheapest structure. When a combination flops, the next move is to look at the trade-off, decide which criterion matters more, and pick accordingly. Sometimes the best v4 is closer to one of the originals than a true mash-up.
Rank your criteria before you analyze. If load capacity matters more than cost, the strongest design's features get priority. If cost rules, the cheapest design's features lead. Engineering isn't math class with one right answer. It's a defended choice based on which criterion you decided mattered most.
📓 Teaching Resources for MS-ETS1-3
These resources are aligned to this standard.
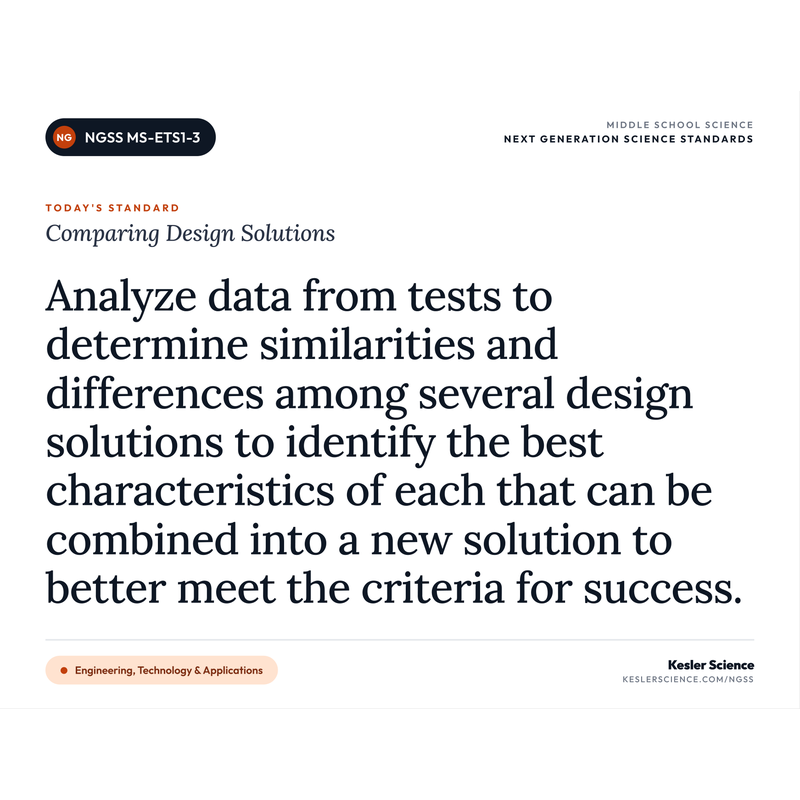
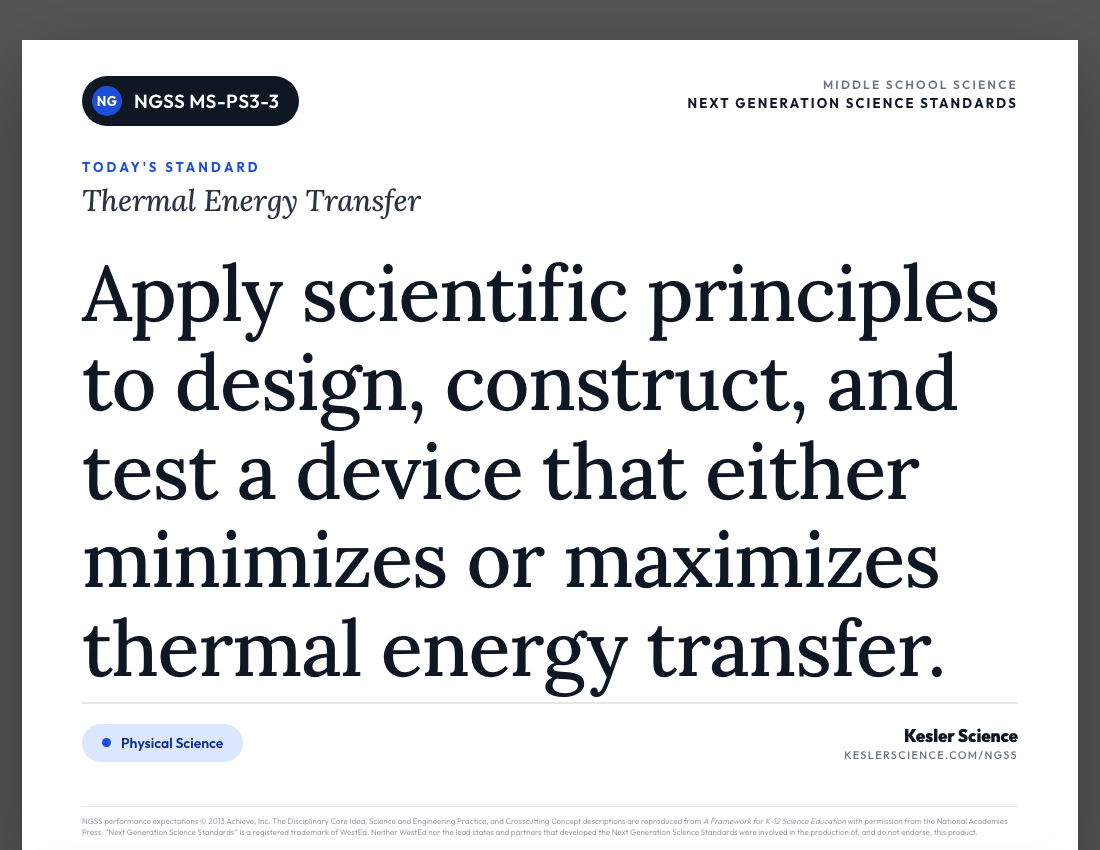
Print-ready classroom poster pack for MS-ETS1-3. Includes the verbatim NGSS performance expectation plus student-language "I Can" statements broken into daily learning goals. Landscape orientation, letter size, ready to print and post on your wall.
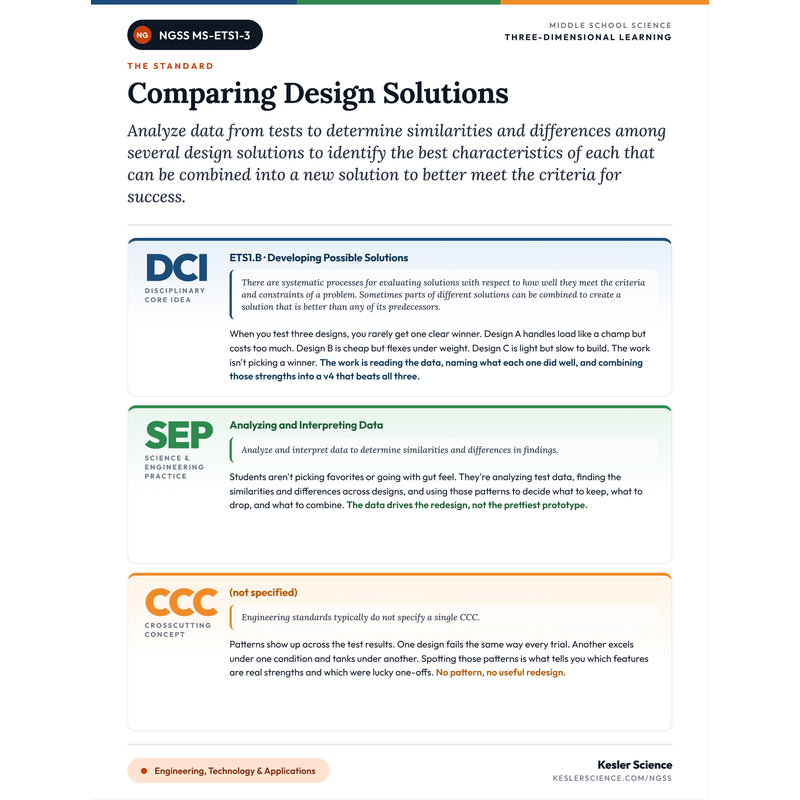
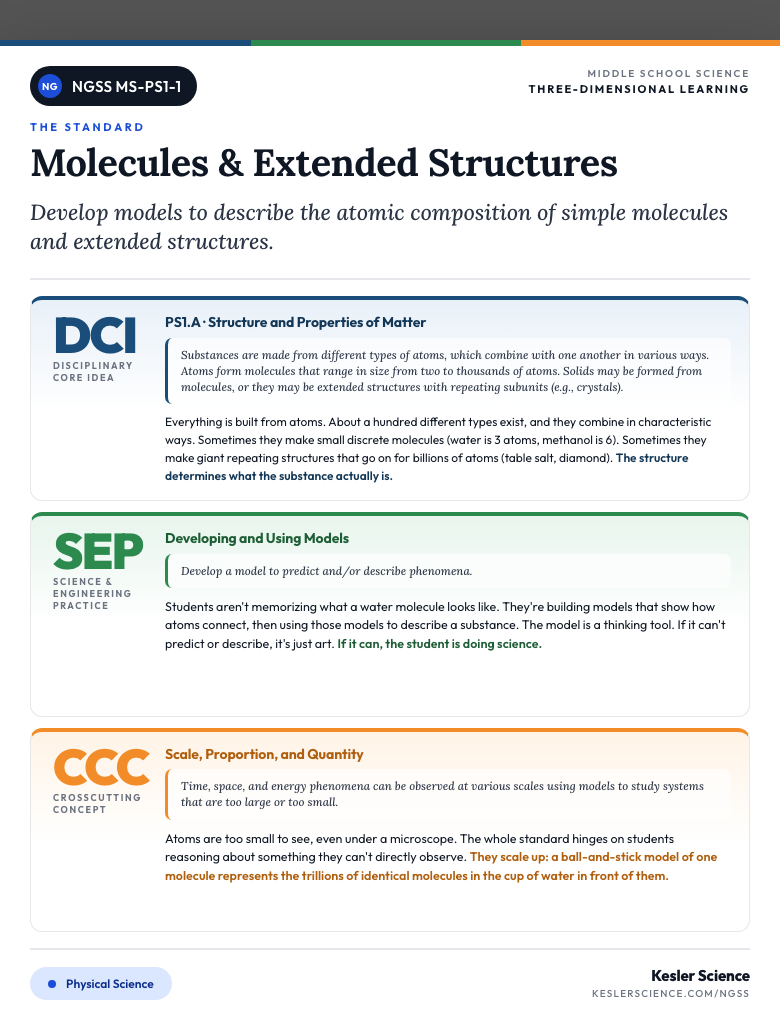
Teacher-facing PDF that breaks down the DCI, SEP, and CCC for MS-ETS1-3 in plain English. Color-coded by dimension so you can read the whole standard at a glance. Perfect for lesson planning or a sub folder.
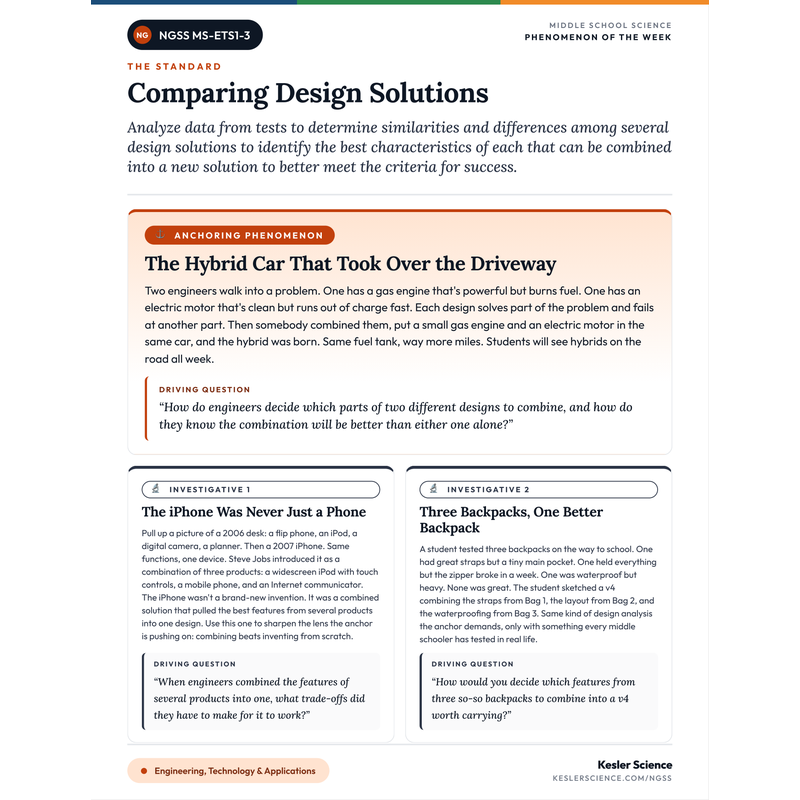
One-page printable with the anchoring phenomenon plus two investigative phenomena for MS-ETS1-3. Each one comes with the driving question students will keep asking. Pin it above your desk for the week. One piece of paper, one week of hooks.
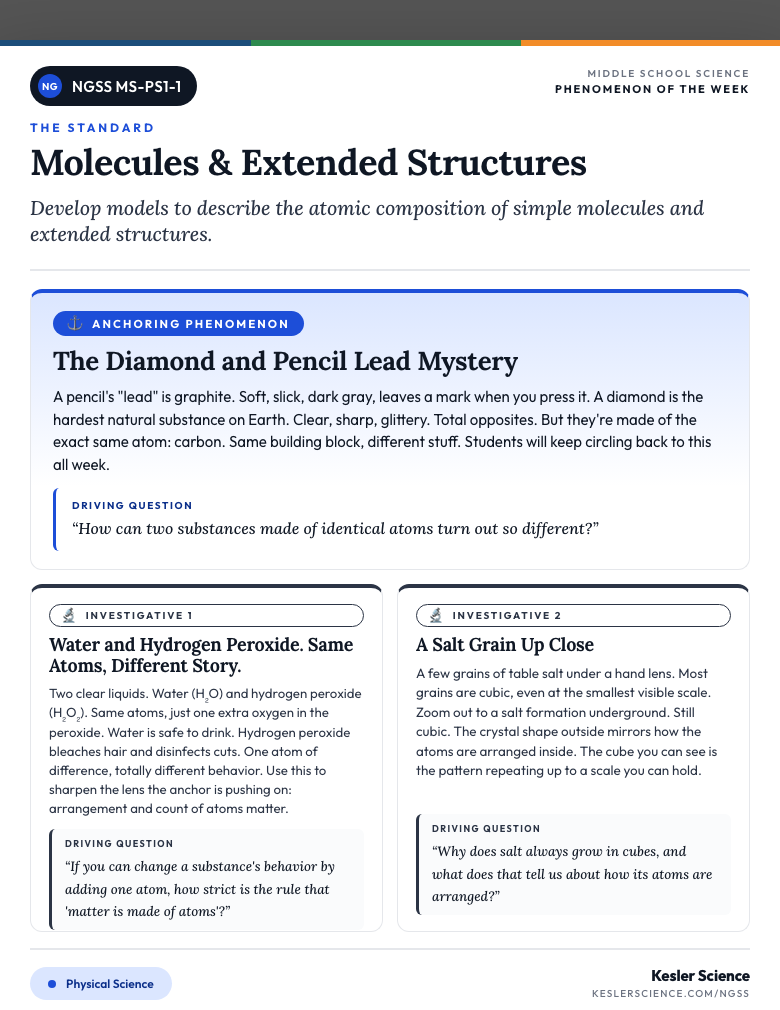
Teaching more than this one standard?
Get every I Can poster, phenomenon hook, and 3-dimension sheet for all 59 Middle School standards, in one download. The whole year, ready to print.
📚 Vocabulary Students Need for MS-ETS1-3
Twelve terms students need to access this standard. Definitions in plain-English, classroom-ready language.
The things a successful design must do. Hold a certain weight. Cost under a certain amount. Fit in a certain space. Criteria are the targets.
The limits the design has to live inside. Time, materials, budget, size. Constraints are the walls.
A specific version of an engineered object built to meet the criteria. v1, v2, v3, and v4 are all design solutions.
The next version, built using what was learned from testing the previous one. Redesign is where the data does its work.
A choice where improving one criterion makes another worse. Stronger usually means heavier. Cheaper usually means less durable. Trade-offs force a priority call.
One cycle of build, test, analyze, redesign. Engineering is iterative. v4 is the fourth iteration.
The measurements you collect during testing. Numbers, observations, failure points, costs. Data is what you'll analyze later.
What you look for when comparing multiple designs. Where did they perform the same? Where did they diverge? Both matter.
A consistent result across multiple designs or multiple trials. If every arched design held more weight, that's a pattern worth using in the redesign.
A feature of one design that outperformed the same feature in the other designs. Best is always relative to a specific criterion.
The act of pulling features from multiple designs into one new solution. The combination is the heart of this standard.
A side-by-side look at what a design costs (money, time, materials) versus what it delivers (performance). Used to defend a redesign choice.
💡 Free Engagement Ideas for MS-ETS1-3
Three-Bridge Cherry-Pick
Teams build three paper bridges with the same budget (1 sheet of cardstock, 50 cm of tape, same span). Each team uses a different design: beam, truss, arch. They test all three under load (washers in a cup) and record load at failure, where it failed, and total tape used. Then they design a v4 that combines the strongest features from at least two of the three. Sketch and defend with data.
Water Filter Mash-Up
Students get specs and customer reviews for three real water filter designs (a pitcher, a faucet attachment, a portable straw filter). They build a comparison chart: filtration speed, cost, portability, replacement filter cost, and one drawback. Then they propose a hybrid design that pulls the best feature from each and explain which trade-off they had to accept. No actual filter is built. The work is in the analysis and the defense.
School Chair Redesign Studio
Teams photograph or sketch three different chairs around the school: cafeteria chair, classroom chair, library chair. They build a criteria chart (comfort, durability, stackability, cost). They rate each chair 1-5 on each criterion based on a 5-minute sit-test. Then they design a v4 school chair combining the best features for "all-day comfort during testing season." Defend with the ratings.
Catapult Combine
Pre-built or student-built mini catapults using three different launch mechanisms (spoon-and-rubber-band, popsicle-stick tension, mousetrap). Students measure launch distance, accuracy (hits within a 30 cm target), and reload time across 5 trials each. Analyze the data. Then sketch a v4 mechanism combining the best features. Optional extension: build it and re-test.
📝 Assessment Ideas for MS-ETS1-3
Three short tasks that hit all three dimensions. Doable in one class period each.
Students get a pre-made data table showing three bridge designs tested on three criteria (load, cost, build time). They write a paragraph identifying the best feature from each design (tied to the data), then sketch a v4 combining those features. They label the sketch and write a 2-3 sentence defense citing the data.
Students get four "combined" design proposals. Two correctly pull features supported by the data. Two pull features that contradict the data (claim a "strong" feature when the data shows that feature failed). Students mark which proposals are data-backed, which aren't, and explain the error citing specific numbers from the table.
Students get a scenario where the best two features from a test set can't both go into v4 (combining them breaks the budget or exceeds weight limits). They have to pick one, drop the other, and write a defense explaining which criterion they prioritized and why. The grade rests on the defense, not on which feature they picked.
🎯 What Proficient Student Work Looks Like
Same prompt, three student responses at different proficiency levels. Use as anchor papers when scoring.
"Three teams tested paper bridges. Use the data table below to identify the best feature from each design and describe a v4 that combines those features. Defend your choices with the data."
- A specific claim backed by data, observation, or model
- Use of standard-specific vocabulary in context
- Connection between the visible and the underlying explanation
- A question they're still wondering about (curiosity stays alive)
Design B held the most weight, so I would build my v4 like Design B. It was the best one. I would also use Design A's paper because Design A was lighter.
Picks a feature but doesn't tie it to specific data. Treats one design as a winner instead of pulling features from multiple. Doesn't address trade-offs. Stops at "Design B was best."
Design B held 2.1 kg, more than Design A (1.4 kg) and Design C (1.7 kg). So I would use Design B's truss shape in my v4. Design A used the least tape (20 cm vs. 50 cm and 35 cm), so I would use Design A's joint style to save material. My v4 would have a truss shape with Design A's joints. The trade-off is that the lighter joints might not hold as much as Design B's original, so I would do another test to check.
Cites specific numbers. Pulls features from two designs and ties each to a criterion. Names a trade-off. Proposes a follow-up test. Hits exactly what the standard is targeting.
Looking at the data, no single design won every category. Design B held the most weight (2.1 kg) because of its truss shape. Design A used the least tape (20 cm) because of its tight folded joints. Design C failed at the lowest load (1.7 kg) but recovered fastest after the weight was removed, suggesting flexible paper. My v4 combines Design B's truss shape, Design A's folded joint style, and Design C's lighter paper grade. The pattern I noticed is that truss shapes held more in every trial. The trade-off I had to accept is that Design C's lighter paper might fail earlier than Design B's heavier paper. I prioritized weight savings over maximum load because the criteria sheet ranked 'lightweight' above 'maximum load.' I would build the v4 and re-test against the same load protocol to confirm.
Quantitative citations throughout. Pulls features from all three designs, each justified by a different criterion. Identifies a pattern across designs (truss = more load). Names the trade-off explicitly. Defends the priority call by referencing the criteria ranking. Proposes the next iteration. This is the analyze-combine-defend chain the standard targets.
“Next Generation Science Standards” is a registered trademark of WestEd. Neither WestEd nor the lead states and partners that developed the Next Generation Science Standards were involved in the production of, and do not endorse, this product.
NGSS performance expectations © 2013 Achieve, Inc. The Disciplinary Core Idea, Science and Engineering Practice, and Crosscutting Concept descriptions are reproduced from A Framework for K-12 Science Education with permission from the National Academies Press.
Trusted Across NGSS States
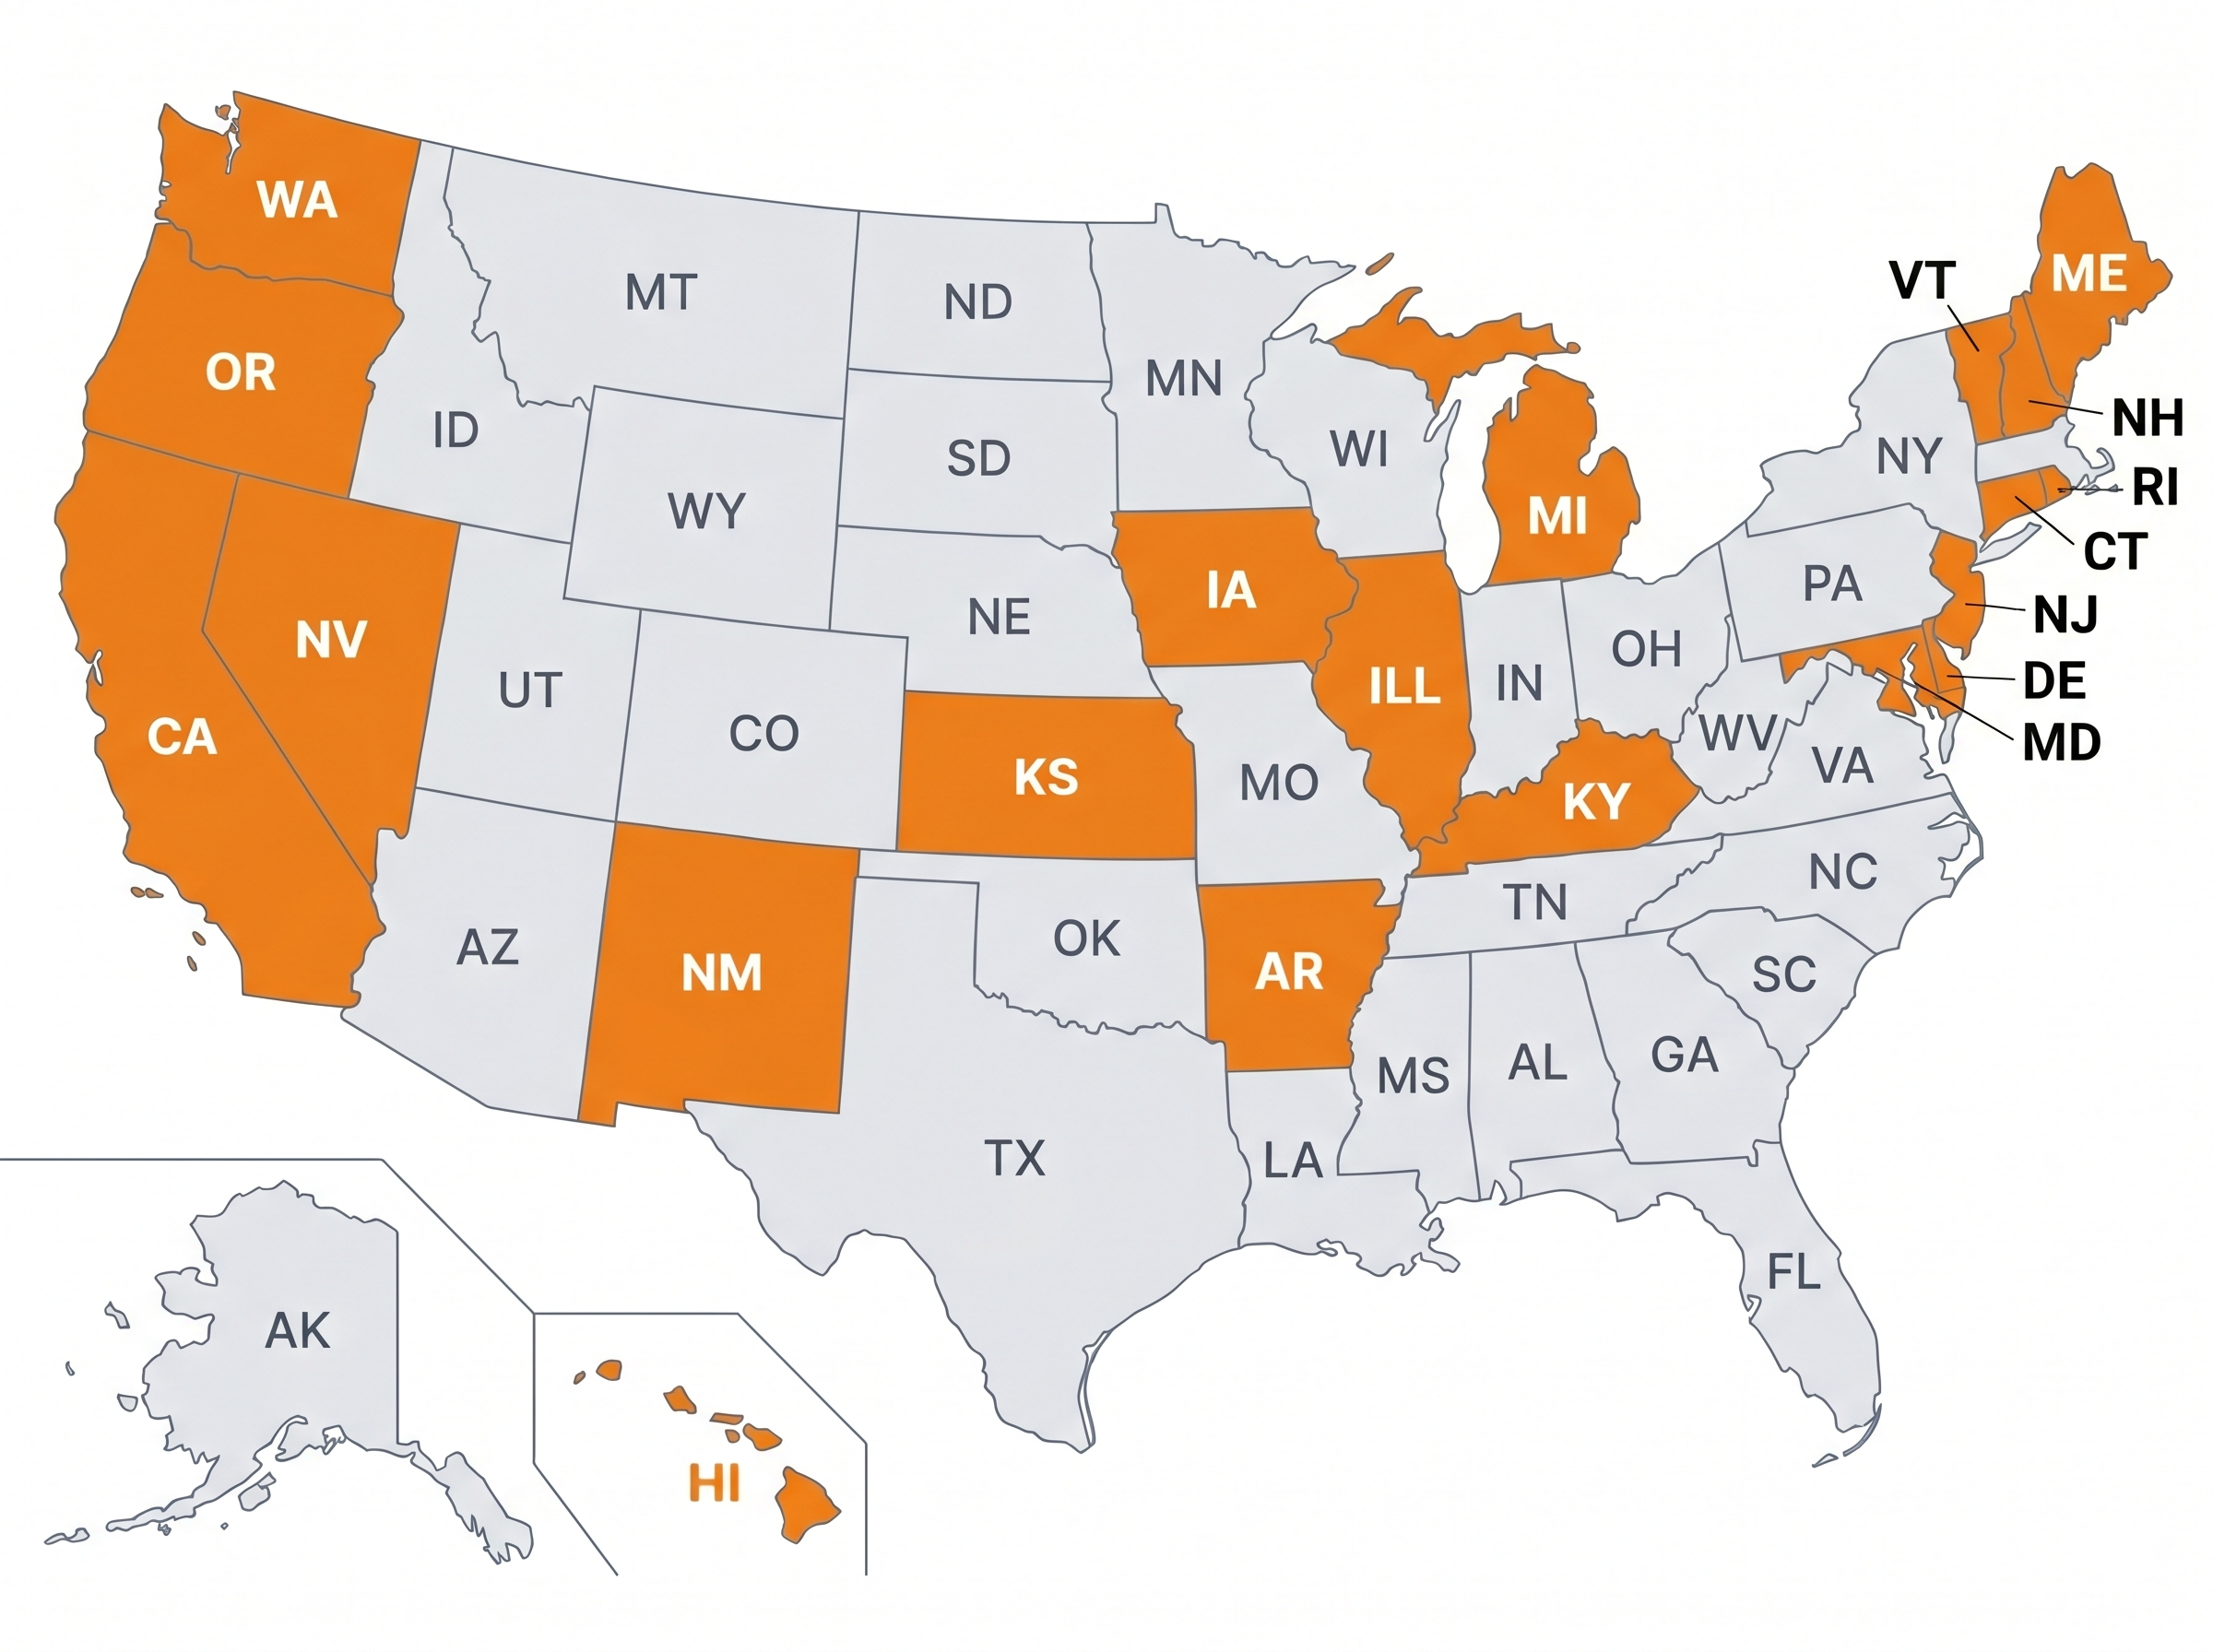
From California to Connecticut, science teachers in the 20 states that adopted NGSS are using Kesler Science to save time and engage students.
Teachers in NGSS States
Love Kesler Science
What Teachers Are Saying
"I'm able to access rigorous NGSS-aligned lessons and labs that are ready to use, so I spend more time helping students directly and less time searching for quality material."
"There's a lesson for each of the NGSS, so I don't have to search for hours to find a good quality lesson. I can spend more time actually teaching."
"The resources help me cover NGSS in a meaningful way, and my students gain a deeper knowledge of the concepts, with learning that's more self-driven."
Give Your Science Teachers Everything They Need
School and district licenses give your teachers access to every resource they need, including station labs, inquiry labs, anchoring phenomena, presentations, escape rooms, and much more. One purchase covers the grade levels you need.
- PO-friendly. We accept purchase orders
- Volume discounts for 11+ teachers
- Complimentary membership orientation for 4+ teachers
- Three free implementation PD sessions for departments of 11+
- Aligned to the NGSS standards
See It in Action
Book a walkthrough and we'll show you how Kesler Science fits your campus.
Book Demo CallNo pressure, no hard sell
"My assistant principal stopped in my room and immediately noticed how the students were engrossed in their centers and how they moved seamlessly from center to center. Also the built-in modifications really impressed!"
"It provides differentiated instruction for all types of learners, allowing them to become more engaged."
"I love it all!! I have become a facilitator in my class and I love the excitement it brings to my class. The kids love all that we do with the Kesler products."