.png?width=375&height=100&name=WebPage%20logo%20with%20curves%202026%20(8).png)
NGSS Resource Hub
Three-dimensional breakdowns, phenomena, and classroom-ready activities for every NGSS standard, grades 4-8.

🚀 Jump to Your Discipline
Middle School NGSS Standards
Pick any standard. Each page is your full lesson-planning workspace for that standard.
Mathematical Models of Natural Selection: Watching Trait Frequencies Shift Over Time
"Use mathematical representations to support explanations of how natural selection may lead to increases and decreases of specific traits in populations over time."
NGSS Lead States. (2013). Next Generation Science Standards: For states, by states (MS-LS4-6). The National Academies Press. https://www.nextgenscience.org/dci-arrangement/ms-ls4-biological-evolution-unity-and-diversity
The focus is on using mathematical models, probability statements, and proportional reasoning to back up explanations of how populations change over time.
Summarized in our own words from the MS-LS4-6 clarification statement (NGSS Lead States, 2013). Not a verbatim quote.
Students are not expected to perform Hardy-Weinberg calculations.
Summarized in our own words from the MS-LS4-6 assessment boundary (NGSS Lead States, 2013). Not a verbatim quote.
The three dimensions packed into this standard
Every standard bundles a DCI (the content), a SEP (the science practice), and a CCC (the crosscutting lens). They run in the same task, not in sequence.
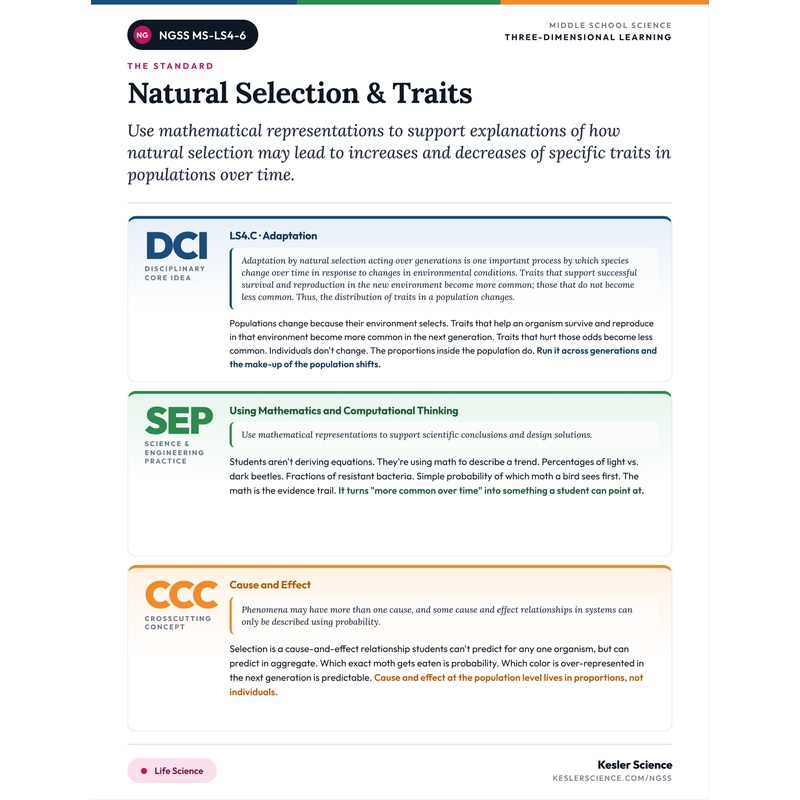
"Adaptation by natural selection acting over generations is one important process by which species change over time in response to changes in environmental conditions. Traits that support successful survival and reproduction in the new environment become more common; those that do not become less common. Thus, the distribution of traits in a population changes."
National Research Council. (2012). A framework for K-12 science education: Practices, crosscutting concepts, and core ideas. The National Academies Press. https://doi.org/10.17226/13165
Populations change because their environment selects. Traits that help an organism survive and reproduce in that environment become more common in the next generation. Traits that hurt those odds become less common. Individuals don't change. The proportions inside the population do. Run it across generations and the make-up of the population shifts.
"Use mathematical representations to support scientific conclusions and design solutions."
National Research Council. (2012). A framework for K-12 science education. The National Academies Press.
Students aren't deriving equations. They're using math to describe a trend. Percentages of light vs. dark beetles. Fractions of resistant bacteria. Simple probability of which moth a bird sees first. The math is the evidence trail. It turns "more common over time" into something a student can point at.
"Phenomena may have more than one cause, and some cause and effect relationships in systems can only be described using probability."
National Research Council. (2012). A framework for K-12 science education. The National Academies Press.
Selection is a cause-and-effect relationship students can't predict for any one organism, but can predict in aggregate. Which exact moth gets eaten is probability. Which color is over-represented in the next generation is predictable. Cause and effect at the population level lives in proportions, not individuals.
📍 Where This Standard Fits in the K-12 Progression
Use this to plan the year. Knowing what students should already know and what they're heading toward keeps the lesson focused.
Some organisms in a population have traits that help them survive better in their environment. Those organisms are more likely to live, reproduce, and pass those traits on.
Mathematical Models of Natural Selection: Watching Trait Frequencies Shift Over Time
Natural selection acts on heritable variation in a population. Over many generations, this changes allele frequencies and can produce new species. Mathematical and statistical models describe how those frequencies shift.
🌎 Phenomena for MS-LS4-6
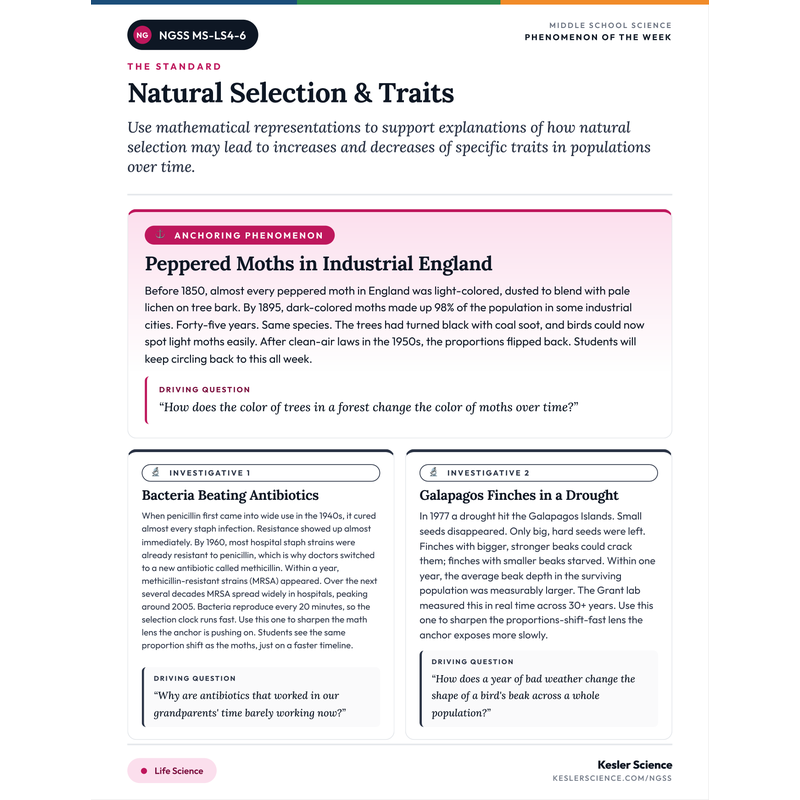
Anchor the lesson in one puzzling phenomenon kids keep coming back to. Use the two investigative phenomena to sharpen specific facets.
Rock Pocket Mice on Lava Flows
In the deserts of New Mexico and Arizona, pale-coated rock pocket mice live on light-colored sandstone. Then a black basalt lava flow cuts across the desert. On the lava, almost every mouse is dark-coated. The rock changed. The mouse coats changed. The DNA records the change at a single pigment gene called MC1R.
"How did the proportion of dark mice on the lava get so high in just a few thousand years?"
- "Did the lava turn the mice dark, or were dark mice already there?"
- "Why does it take generations and not a lifetime to shift a population's coat color?"
- "If the lava eroded away, would the dark mice disappear too?"
Cockroach Bait Refusal in Apartment Buildings
Sugar-based bait used to kill cockroaches almost every time. By the late 1990s, exterminators noticed roaches walking right past it. Researchers measured the change: roaches that found sugar tasted bitter survived the bait and reproduced. Within a few years the bitter-tasters dominated whole buildings. Tracking the percentage of bitter-tasters generation by generation shows a math-able trait shift.
"How quickly does the percentage of bitter-taster roaches climb once sugar bait is introduced?"
- "Did the bait teach the roaches to avoid sugar, or did it just kill the ones that didn't?"
- "Could exterminators use a different bait to flip the percentages back?"
- "Why do the bitter-tasters keep dominating even after the sugar bait is gone?"
Stickleback Fish Losing Their Armor
Three-spined sticklebacks come in two flavors. Ocean fish wear heavy bony plates from gill to tail. When ocean populations got trapped in freshwater lakes after the ice age, the armor shrank. Within a few thousand generations, lake sticklebacks lost most of their plates. A single gene called Eda controls how much armor a fish builds, and you can count the plates and graph the shift.
"Why did heavy body armor become a bad trait in fresh water when it kept ocean sticklebacks alive for millions of years?"
- "If armor protects against predators, why did the lake fish drop it?"
- "Are the lake and ocean fish still the same species?"
- "How would a graph of plate counts over generations look in a lake compared to the ocean?"
100% Aligned Lessons for Every NGSS Standard You Teach
The membership gives you access to thousands of lessons and activities designed to boost student engagement and reclaim valuable teaching time. Trusted by schools and districts from every NGSS state.
⚠️ Misconceptions Your Students Will Walk In With
These come up almost every year. Knowing them in advance lets you head them off in the first lesson.
"Individual organisms evolve over their lifetime"
Individuals don't evolve. Populations do. A dark beetle stays a dark beetle for its whole life. What changes is the proportion of dark vs. light beetles across generations, because the survivors of each generation pass on their traits. Evolution is a population-level process measured in proportions, not a personal transformation.
"Mutations happen because the organism needs them"
Mutations are random. They happen all the time, regardless of what the organism needs. The environment doesn't cause useful mutations. It just selects which existing variations survive. A bacterium doesn't become resistant because it's near antibiotics. The resistant ones were already there, and the antibiotic killed everything else.
"Evolution has a goal or a direction"
Selection has no goal. Whatever trait helps survival and reproduction in this environment becomes more common. Change the environment, and a different trait wins. Light shells help when the ground is light. Dark shells help when the ground is dark. There's no "better" trait, only a better fit for the current conditions.
"Bigger or stronger always wins"
Selection favors whatever fits the environment, not raw size or strength. Sometimes smaller wins because food is scarce. Sometimes drab coloring wins because predators see bright. Sometimes resistance to a specific antibiotic wins even though it costs the bacterium energy in every other way. Fit beats strong, and fit is defined by the environment.
🙋 Common Student Questions and How to Respond
These come up almost every time this standard gets taught. Plan a response and you'll keep the lesson focused.
Some examples are slow. Some are fast. Bacteria reproduce every 20 minutes, so antibiotic resistance can shift in months. Insects with pesticide resistance shift in a few years. The Grant lab in the Galapagos measured finch beak changes inside a single drought, around 30 years of data. We see it happening because we measure proportions in real populations over time.
They can't. An individual beetle is born with the shell color it has, and that doesn't change. What changes is the next generation. The light beetles that survived had babies. More of those babies have light shells. Across generations, the population shifts. The individual didn't change. The proportions did.
Then that trait can't get more common, because there's nothing to select for. Selection only acts on the variation that already exists in the population. If a population has no variation in a useful direction, it can't adapt that way. It might go extinct, or a random mutation might eventually produce that variation, or it might survive through a different trait we didn't expect.
Same mechanism, different selector. In natural selection, the environment picks which traits get passed on. In artificial selection, humans pick. Dog breeds, modern corn, dairy cows. Same math: proportions of traits shift across generations because of which parents reproduce. The cause is different, but the effect on the population looks the same.
📓 Teaching Resources for MS-LS4-6
These resources are aligned to this standard.
Print-ready classroom poster pack for MS-LS4-6. Includes the verbatim NGSS standard plus student-language "I Can" statements broken into daily learning goals. Landscape letter, ready to print and post on your wall.
Teacher-facing PDF that breaks down the DCI, SEP, and CCC for MS-LS4-6 in plain English. Color-coded by dimension so you can read the whole standard at a glance. Perfect for lesson planning or a sub folder.
One-page printable with the anchoring phenomenon plus two investigative phenomena for MS-LS4-6. Each one comes with the driving question students will keep asking. Pin it above your desk for the week. One piece of paper, one week of hooks.

A hands-on inquiry investigation where students investigate how environmental and genetic factors shape which traits help organisms survive and get passed to the next generation. Includes student handouts, teacher guide, and materials list. 3 versions for differentiation. Both print and digital version included.

A hands-on inquiry investigation where students compare how natural selection and human-driven artificial selection change which traits show up in a population over time. Includes student handouts, teacher guide, and materials list. 3 versions for differentiation. Both print and digital version included.

An anchoring phenomenon—Lizard Evolution—that bookends your natural selection lesson with an intro reading and an explanatory reading, each with comprehension and extension questions. Includes teacher directions with answer keys, projection slides, editable digital PPTs, and print handouts for INBs.

A leveled nonfiction reading passage that builds science literacy while reinforcing natural selection. Students read an engaging article—Effects of Natural Selection—then answer comprehension questions. Two reading levels for differentiation. Includes the passage, comprehension questions, answer key, and both print and digital versions.

A print-and-digital science writing activity where students reason and write about natural selection through an engaging real-world prompt. Includes teacher directions with an answer guide and project ideas. Great for constructed response, bell-ringers, or science journals.
Teaching more than this one standard?
Get every I Can poster, phenomenon hook, and 3-dimension sheet for all 59 Middle School standards, in one download. The whole year, ready to print.
📚 Vocabulary Students Need for MS-LS4-6
Twelve terms students need to access this standard. Definitions in plain-English, classroom-ready language.
All the organisms of one species living in the same area. Evolution happens to populations, not individuals.
A feature of an organism, like shell color, beak size, or antibiotic resistance. Traits can be inherited from parents.
The differences in traits within a population. Some beetles are light, some are dark. Variation is what selection acts on.
One round of reproduction. Trait frequencies are compared from generation to generation.
A trait that helps an organism survive and reproduce in its environment. Becomes more common over generations through selection.
The process where traits that help survival and reproduction become more common in a population over time.
Something in the environment that affects which organisms survive and reproduce. A predator, a disease, a temperature change.
The fraction or percentage of a population that has a specific trait. If 20 out of 100 beetles are light, the proportion is 20%, or 1 in 5.
The likelihood of an outcome. In selection, we use probability to talk about which traits are more likely to be passed on.
A pattern of change over time. A line graph showing percent dark beetles climbing each generation shows a trend.
💡 Free Engagement Ideas for MS-LS4-6
Bird and Beetle Bead Simulation
Each group gets 50 beads. 10 light, 40 dark. They spread them on a dark-colored cloth (camouflages dark beetles). A "bird" picks 15 beads in 10 seconds. Most are light. Survivors reproduce by doubling. Students track percentages across 3 generations and graph the trend. Then they swap to a light cloth and run it again. The trend reverses. Same math, opposite outcome.
Antibiotic Resistance Graph Reading
Students get a real (or realistic) data set showing the percentage of MRSA in U.S. hospitals from 1975 to 2020. They build a line graph, identify when the percentage started climbing fast, and write a paragraph using percentages to describe what's happening. Then they predict where the line will be in 2030 and explain why.
Galapagos Finch Card Sort
Students get 20 cards, each showing a finch with a different beak size. They sort the cards into "before drought" and "after drought" groups based on which beaks could crack big hard seeds. They calculate the average beak depth in each group. The "after" group's average is bigger, because the small-beak finches didn't survive.
PhET Natural Selection Simulation
Students use the free PhET Natural Selection sim. They start with a population of bunnies, then add a selection pressure (wolves, food shortage, or temperature). They watch the trait proportions shift across generations, screenshot a few key moments, and write a short caption for each describing what's happening and why.
📝 Assessment Ideas for MS-LS4-6
Three short tasks that hit all three dimensions. Doable in one class period each.
Students get a line graph showing the percentage of a trait in a population across 5 generations. The percentage goes from 25% to 70%. They write a 3-4 sentence explanation that names the selection pressure, identifies which trait got more common, and uses at least two specific percentages to support the claim.
Students get a starting population (e.g., 60% dark beetles, 40% light beetles) and a selection pressure (light-colored ground, visual bird predators). They predict the percentages in the next generation and justify with a probability statement. Then they're shown the actual data and asked: what did you get right, and what would you change?
Students get data for the same species in two different environments (one dark-soil, one light-soil) across 5 generations. They graph both, calculate the percent change in dark-bodied individuals in each environment, and write an explanation for why the same species ends up with opposite trait proportions.
🎯 What Proficient Student Work Looks Like
Same prompt, three student responses at different proficiency levels. Use as anchor papers when scoring.
"Use the data table to explain how natural selection changed the proportion of light and dark beetles in this population across 3 generations."
- A specific claim backed by data, observation, or model
- Use of standard-specific vocabulary in context
- Connection between the visible and the underlying explanation
- A question they're still wondering about (curiosity stays alive)
The beetles changed colors over time. There were more dark beetles at the start and more light beetles at the end. The birds ate the dark ones because they could see them. So the light ones lived.
Names the change in general terms but doesn't use percentages or proportions. Doesn't tie the math to the explanation. Hints at the cause but stops short of the population-level reasoning the standard asks for.
At the start, 20% of the beetles were light and 80% were dark. By generation 3, 65% were light and 35% were dark. The ground was light-colored, so the birds could see dark beetles more easily and ate more of them. The light beetles survived more, so they had more babies, and more of the next generation was light. The percentage of light beetles went up each generation because birds were a selection pressure against dark beetles.
Uses specific percentages from the data. Connects the math to the cause (camouflage, bird selection pressure). Uses population-level language. Hits exactly what the standard is targeting.
The proportion of light beetles increased from 20% in Generation 1 to 65% in Generation 3, a 45 percentage-point shift in just two generations. The selection pressure was visual predation by birds against a light-colored background. Because dark beetles stood out, they were more likely to be eaten before they could reproduce. The survivors were disproportionately light, so a higher percentage of the next generation inherited the light shell trait. This is natural selection: the environment didn't change the individual beetles, it changed which beetles reproduced. If the ground changed color, I'd expect the trend to reverse, because then dark beetles would be the better-camouflaged variant.
Uses precise percentages and quantifies the change. Names the selection pressure specifically. Distinguishes individual-level from population-level change (the key MS-LS4-6 distinction). Predicts how the system would respond to a different environment, showing transfer. This is exactly the math-supports-explanation reasoning the standard targets.
“Next Generation Science Standards” is a registered trademark of WestEd. Neither WestEd nor the lead states and partners that developed the Next Generation Science Standards were involved in the production of, and do not endorse, this product.
NGSS performance expectations © 2013 Achieve, Inc. The Disciplinary Core Idea, Science and Engineering Practice, and Crosscutting Concept descriptions are reproduced from A Framework for K-12 Science Education with permission from the National Academies Press.
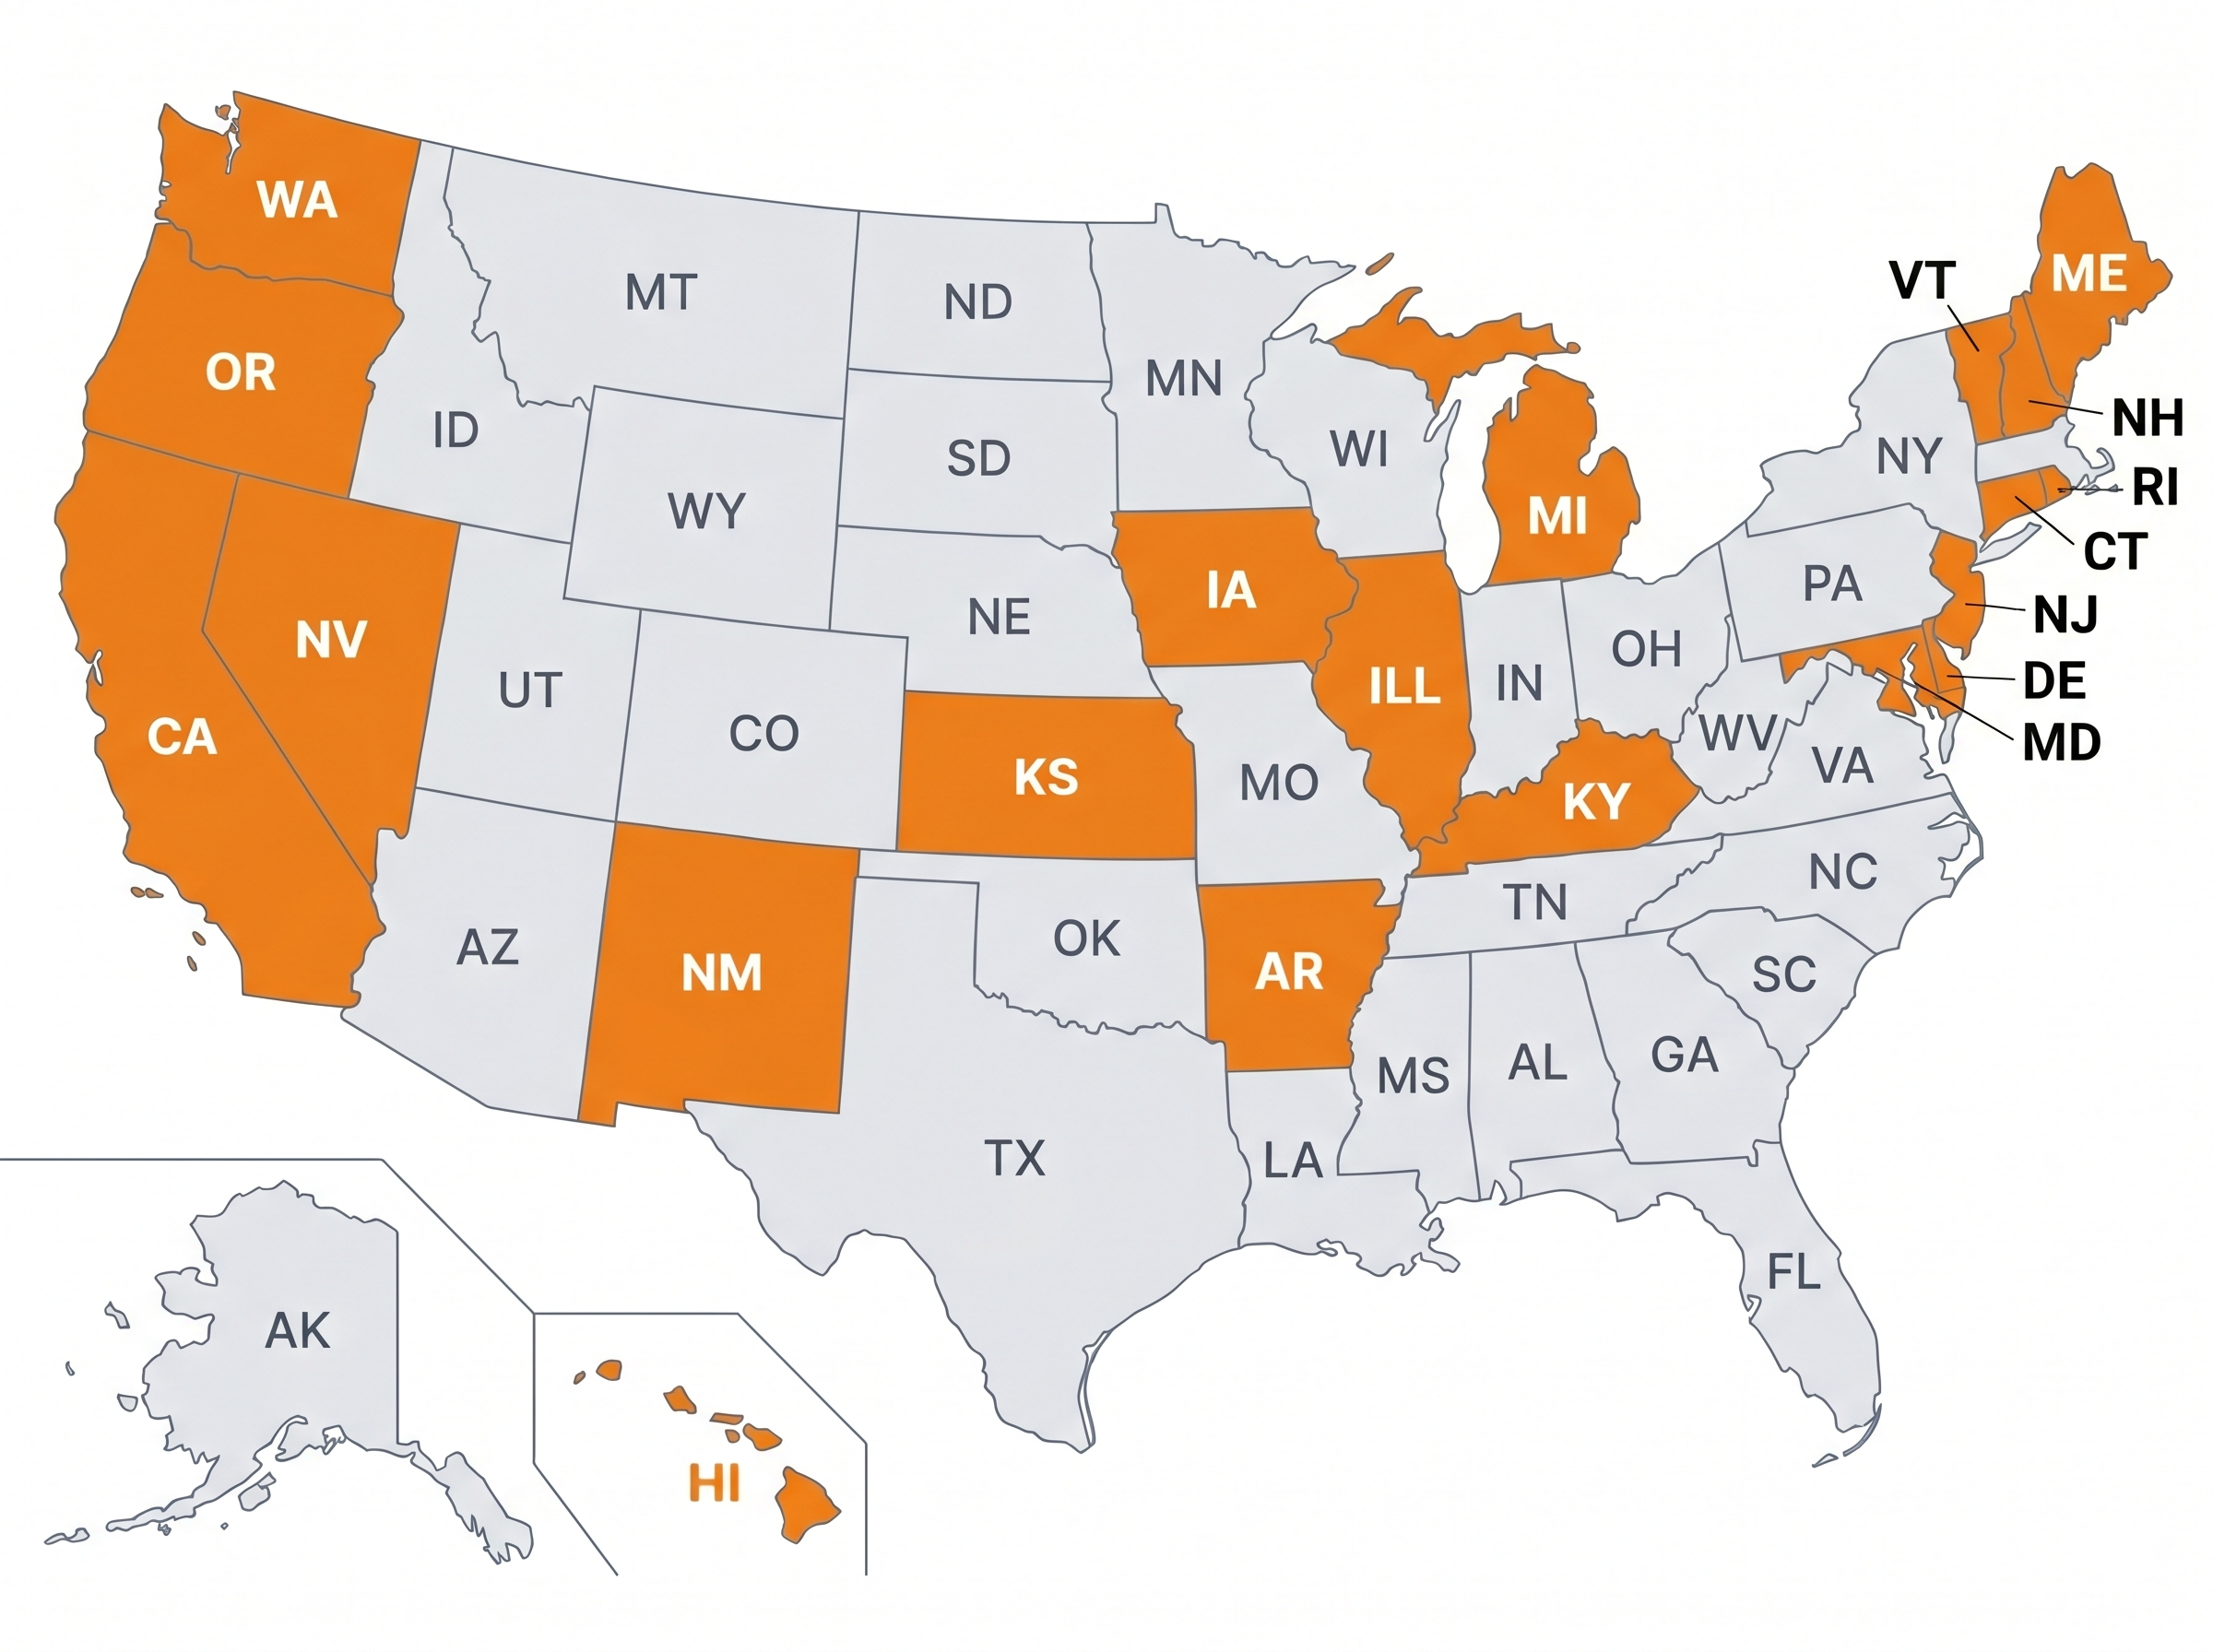
Trusted Across NGSS States
From California to Connecticut, science teachers in the 20 states that adopted NGSS are using Kesler Science to save time and engage students.
Teachers in NGSS States
Love Kesler Science
What Teachers Are Saying
"I'm able to access rigorous NGSS-aligned lessons and labs that are ready to use, so I spend more time helping students directly and less time searching for quality material."
"There's a lesson for each of the NGSS, so I don't have to search for hours to find a good quality lesson. I can spend more time actually teaching."
"The resources help me cover NGSS in a meaningful way, and my students gain a deeper knowledge of the concepts, with learning that's more self-driven."
Give Your Science Teachers Everything They Need
School and district licenses give your teachers access to every resource they need, including station labs, inquiry labs, anchoring phenomena, presentations, escape rooms, and much more. One purchase covers the grade levels you need.
- PO-friendly. We accept purchase orders
- Volume discounts for 11+ teachers
- Complimentary membership orientation for 4+ teachers
- Three free implementation PD sessions for departments of 11+
- Aligned to the NGSS standards
See It in Action
Book a walkthrough and we'll show you how Kesler Science fits your campus.
Book Demo CallNo pressure, no hard sell
"My assistant principal stopped in my room and immediately noticed how the students were engrossed in their centers and how they moved seamlessly from center to center. Also the built-in modifications really impressed!"
"It provides differentiated instruction for all types of learners, allowing them to become more engaged."
"I love it all!! I have become a facilitator in my class and I love the excitement it brings to my class. The kids love all that we do with the Kesler products."