
Texas Science Teacher Resource Hub
Free scope and sequences, TEKS breakdowns, phenomenon ideas, and engagement activities for the 2024 Texas science standards.

🚀 Jump to Your Grade
Pick your grade level and go straight to your TEKS standards, aligned resources, and teaching tools.
-
4th
→4th Grade Science20 standards • Matter, Earth, Energy & more
-
5th
→5th Grade Science19 standards • Matter, Ecosystems, Space & more
-
6th
→6th Grade Science24 standards • Forces, Energy, Matter & more
-
7th
→7th Grade Science27 standards • Cells, Chemistry, Earth & more
-
8th
→8th Grade Science24 standards • Newton's Laws, Space, Genetics & more
8th Grade TEKS Standards
Click any standard to see what it means, how to teach it, where students get stuck, and aligned resources.
Tropical Storms
"Describe the interactions between ocean currents and air masses that produce tropical cyclones, including typhoons and hurricanes."
💡 What This Standard Actually Means
"Describe". Students explain how ocean currents and air masses interact to produce tropical cyclones. The standard uses "including", which signals where to focus your students: typhoons and hurricanes. Students should be able to describe how warm ocean water feeds energy into a developing storm, how converging air masses shape its rotation, and why these storms form in specific regions. Instruction can take many forms, such as labeled formation diagrams, water-temperature maps, case studies of named storms, and cause-and-effect flow charts.
Hurricanes, typhoons, and cyclones are all the same kind of storm. They are just named differently based on where they form. In the Atlantic and Eastern Pacific, they are called hurricanes. In the Western Pacific, they are called typhoons. In the Indian Ocean and near Australia, they are called cyclones. The science behind them is identical.
These storms form over warm ocean water. They need sea surface temperatures of about 80 degrees Fahrenheit (27 degrees Celsius) down to a depth of roughly 50 meters. Warm water evaporates, rises as water vapor, and releases huge amounts of energy when it condenses into clouds. That release of heat fuels the storm. Low wind shear in the upper atmosphere lets the storm keep a tall, organized structure instead of tearing apart.
A mature tropical storm has two key features. The eye is the calm, clear center where air is sinking. The eyewall is the ring of towering thunderstorms around the eye, where the strongest winds and heaviest rain happen. Scientists use the Saffir-Simpson scale (Category 1 through 5) to classify hurricanes based on sustained wind speed. They forecast the path using satellite imagery, buoy data, reconnaissance aircraft that fly into the storm, and computer models that run multiple scenarios. Storms usually weaken when they move over cold water or land because they lose their fuel source.
For Texas classrooms especially, this standard is not abstract. A lot of my students had a Harvey story, or an Ike story, or a Laura story. I'd always open the unit by asking how many had been through a hurricane or knew someone who had. Almost every hand went up. That shared experience is your best anchor. From there, I'd show a loop of satellite imagery of a hurricane forming, intensifying over the Gulf, and weakening after landfall. Students could literally see the storm breathe. Pause the loop and ask them what they notice about the eye, the eyewall, and the moment the storm crosses onto land. Their observations end up matching the science almost word for word, and that's when the formal vocabulary actually sticks.
⚠️ Misconceptions Your Students May Have
These are some of the most common misconceptions. Knowing what to look for can help you get ahead of them.
"Hurricanes, typhoons, and cyclones are different kinds of storms"
They are actually the same type of storm with different regional names. A tropical cyclone in the Atlantic or Eastern Pacific is called a hurricane. In the Western Pacific, the same storm is called a typhoon. In the Indian Ocean and near Australia, it is simply called a cyclone. The formation process, structure, and behavior are the same.
"The eye of the hurricane is the most dangerous part"
The eye is actually the calmest part of the storm, with light winds and sometimes even clear skies. The eyewall, which is the ring of thunderstorms surrounding the eye, has the strongest winds and heaviest rain. Many people have been fooled by the quiet eye passing over, stepped outside, and then been caught by the back half of the eyewall hitting from the opposite direction.
"Category 5 hurricanes cause the most damage every time"
Category is based only on sustained wind speed, but a huge amount of hurricane damage comes from storm surge, rainfall flooding, and tornadoes. A slow-moving Category 1 or 2 storm can dump more rain and cause more flooding damage than a fast-moving Category 5. Hurricane Harvey (2017) is a Texas example: by landfall winds it was a Category 4, but the catastrophic damage came from days of rainfall after the storm stalled.
"Hurricanes can form anywhere in the ocean"
Tropical storms need very specific conditions to form: warm ocean water around 80 degrees Fahrenheit (about 27 degrees Celsius) down to roughly 50 meters deep, moist air, and low wind shear. They also need to be at least several degrees of latitude away from the equator so the Coriolis effect can organize the rotation. That is why you do not see hurricanes forming directly on the equator, in the South Atlantic, or in cold water regions.
📓 Teaching Resources for 8.10C
These resources are aligned to this standard.


100% Aligned Lessons for Every TEKS You Teach
The membership gives you access to thousands of lessons and activities designed to boost student engagement and reclaim valuable teaching time. Trusted by schools and districts all over the great state of Texas.
🌎 Phenomenon Ideas for 8.10C
Use these real-world phenomena to anchor your lesson. Show students the phenomenon first, let them wonder, then build toward Tropical Storms as the explanation.
Hurricane Harvey Stalling Over Texas
In August 2017, Hurricane Harvey made landfall near Rockport, Texas, as a Category 4 storm. Instead of moving inland and weakening, the storm stalled over southeast Texas for about four days. Parts of southeast Texas received over 60 inches of rain from a single storm (60.58 inches near Nederland, Texas), the all-time tropical-cyclone rainfall record for the continental United States.
"Most hurricanes weaken quickly after landfall. What could cause a storm to stall instead of moving inland and dying out? If the wind category describes the wind, why was so much of Harvey's damage caused by rainfall?"
The Eerie Calm of the Eye
Interviews after major hurricanes often include people who describe a moment during the storm when the wind suddenly stopped, the rain ended, and they could even see blue sky through the clouds. Some of them stepped outside, thinking the storm had passed, and got caught when the wind slammed back minutes later, this time from the opposite direction.
"How could one storm have a calm center surrounded by the strongest winds? Why would the wind after the calm come from the opposite direction compared to before the calm?"
The Spaghetti Plot Cone of Uncertainty
Before a hurricane approaches the Gulf Coast, the National Hurricane Center releases forecast maps with many different colored lines, all showing possible paths the storm could take. These are sometimes called "spaghetti plots." A few days out, those lines can spread across hundreds of miles. As landfall gets closer, the lines bunch together into a much narrower path.
"Why are there so many different lines on the forecast map? What kinds of data would scientists need to collect and analyze to predict where a hurricane is going to hit? Why do forecasts get more accurate as the storm gets closer?"
💡 Free Engagement Ideas for 8.10C
Track Your Own Hurricane
Give students a blank map of the Atlantic basin and a list of latitude and longitude coordinates from a past hurricane (Harvey, Ike, Laura, and Katrina all have public data). Have them plot each point, connect the dots, and label where the storm intensified, weakened, and made landfall. Then have them explain the changes using sea surface temperature maps.
Build a Hurricane in a Bowl
Fill a large clear bowl or tub with water and add a few drops of food coloring. Use a spoon or straw to stir the water in a slow circle. Watch the shape form: lower water in the middle, raised around the outside, everything rotating around a calm center. This is a loose visual analog for how pressure and rotation organize a storm. Compare to satellite imagery of real storms.
Sea Surface Temperature Map Match
Print a sea surface temperature map of the Atlantic for August (when waters are warmest) and a map for February (when they are coldest). Print hurricane frequency data by month on a separate sheet. Have students compare the maps and explain why almost all Atlantic hurricanes happen between June and November.
Saffir-Simpson Sort
Print cards with short descriptions of real hurricanes: peak winds, storm surge height, rainfall totals, damage photos. Leave the category blank. Have students use the Saffir-Simpson scale to assign a category based only on the wind speed, then discuss why two storms in the same category could cause very different damage.
🎯 What Approaches, Meets, and Masters Thinking Look Like
Here is what student thinking at each level looks like on this one task, so you know what to look for and how to move a student up.
A meteorologist is tracking a tropical storm forming over warm ocean water near the coast of West Africa. Draw a labeled diagram of the storm, then describe the interactions between ocean currents and air masses that produce a tropical cyclone. Be sure to explain how warm ocean water and moving air masses work together to build the storm, and explain why a storm like this is called a hurricane in one part of the world and a typhoon in another.
- A labeled diagram that shows warm ocean water at the bottom, rising moist air, and a rotating storm structure with an eye and an eyewall.
- Warm ocean water named as the energy source: water evaporates, rises, and releases heat when it condenses into clouds, and that heat fuels the storm.
- A description of air masses interacting: moist air converging and rising, with rotation as the storm organizes.
- The interaction stated, not just two separate facts: warm water feeds the rising air, and the moving air masses keep pulling in more warm, moist air.
- Hurricane and typhoon described as the same storm with different regional names, not two different kinds of storm.
- The eye and eyewall placed correctly (calm eye in the center, strongest winds in the eyewall ring around it).
- The hurricane vs. typhoon naming handled correctly. Treating them as different storm types is the easiest place to slip.
The storm forms over warm ocean water. The warm water makes the air rise and that builds clouds and wind, so it turns into a hurricane. A typhoon is a different storm that happens over in the Pacific Ocean. It has stronger winds and forms a different way than a hurricane does.
The warm ocean water heats the air above it. Water evaporates and rises, and when that moist air cools higher up it condenses into clouds and releases heat, which makes the storm grow. As the warm, moist air rises, more air masses move in underneath to take its place, and that moving air starts to spin and organize into a tropical cyclone. The calm center is the eye and the ring of strongest storms around it is the eyewall. This same storm is called a hurricane when it forms in the Atlantic and a typhoon when it forms in the Western Pacific. It is the same kind of storm, just a different name for the region.
A tropical cyclone is really an energy machine. The warm ocean water is the fuel: it evaporates, rises, and releases heat when it condenses, and that heat keeps the air rising. As that air rises, more warm, moist air masses rush in underneath, and the whole system spins and tightens around the eye. So the interaction is a loop, the warm water powers the rising air, and the moving air keeps pulling in more warm water vapor.
That same relationship tells me what happens when a hurricane makes landfall or moves over cold water. Once the storm is over land or cold ocean, there is no more warm water to evaporate, so the fuel is cut off and the rising air slows down. The storm loses its energy source and weakens, which is exactly why hurricanes fall apart after they hit the coast, even though it is the same storm that was so strong over the warm Gulf.
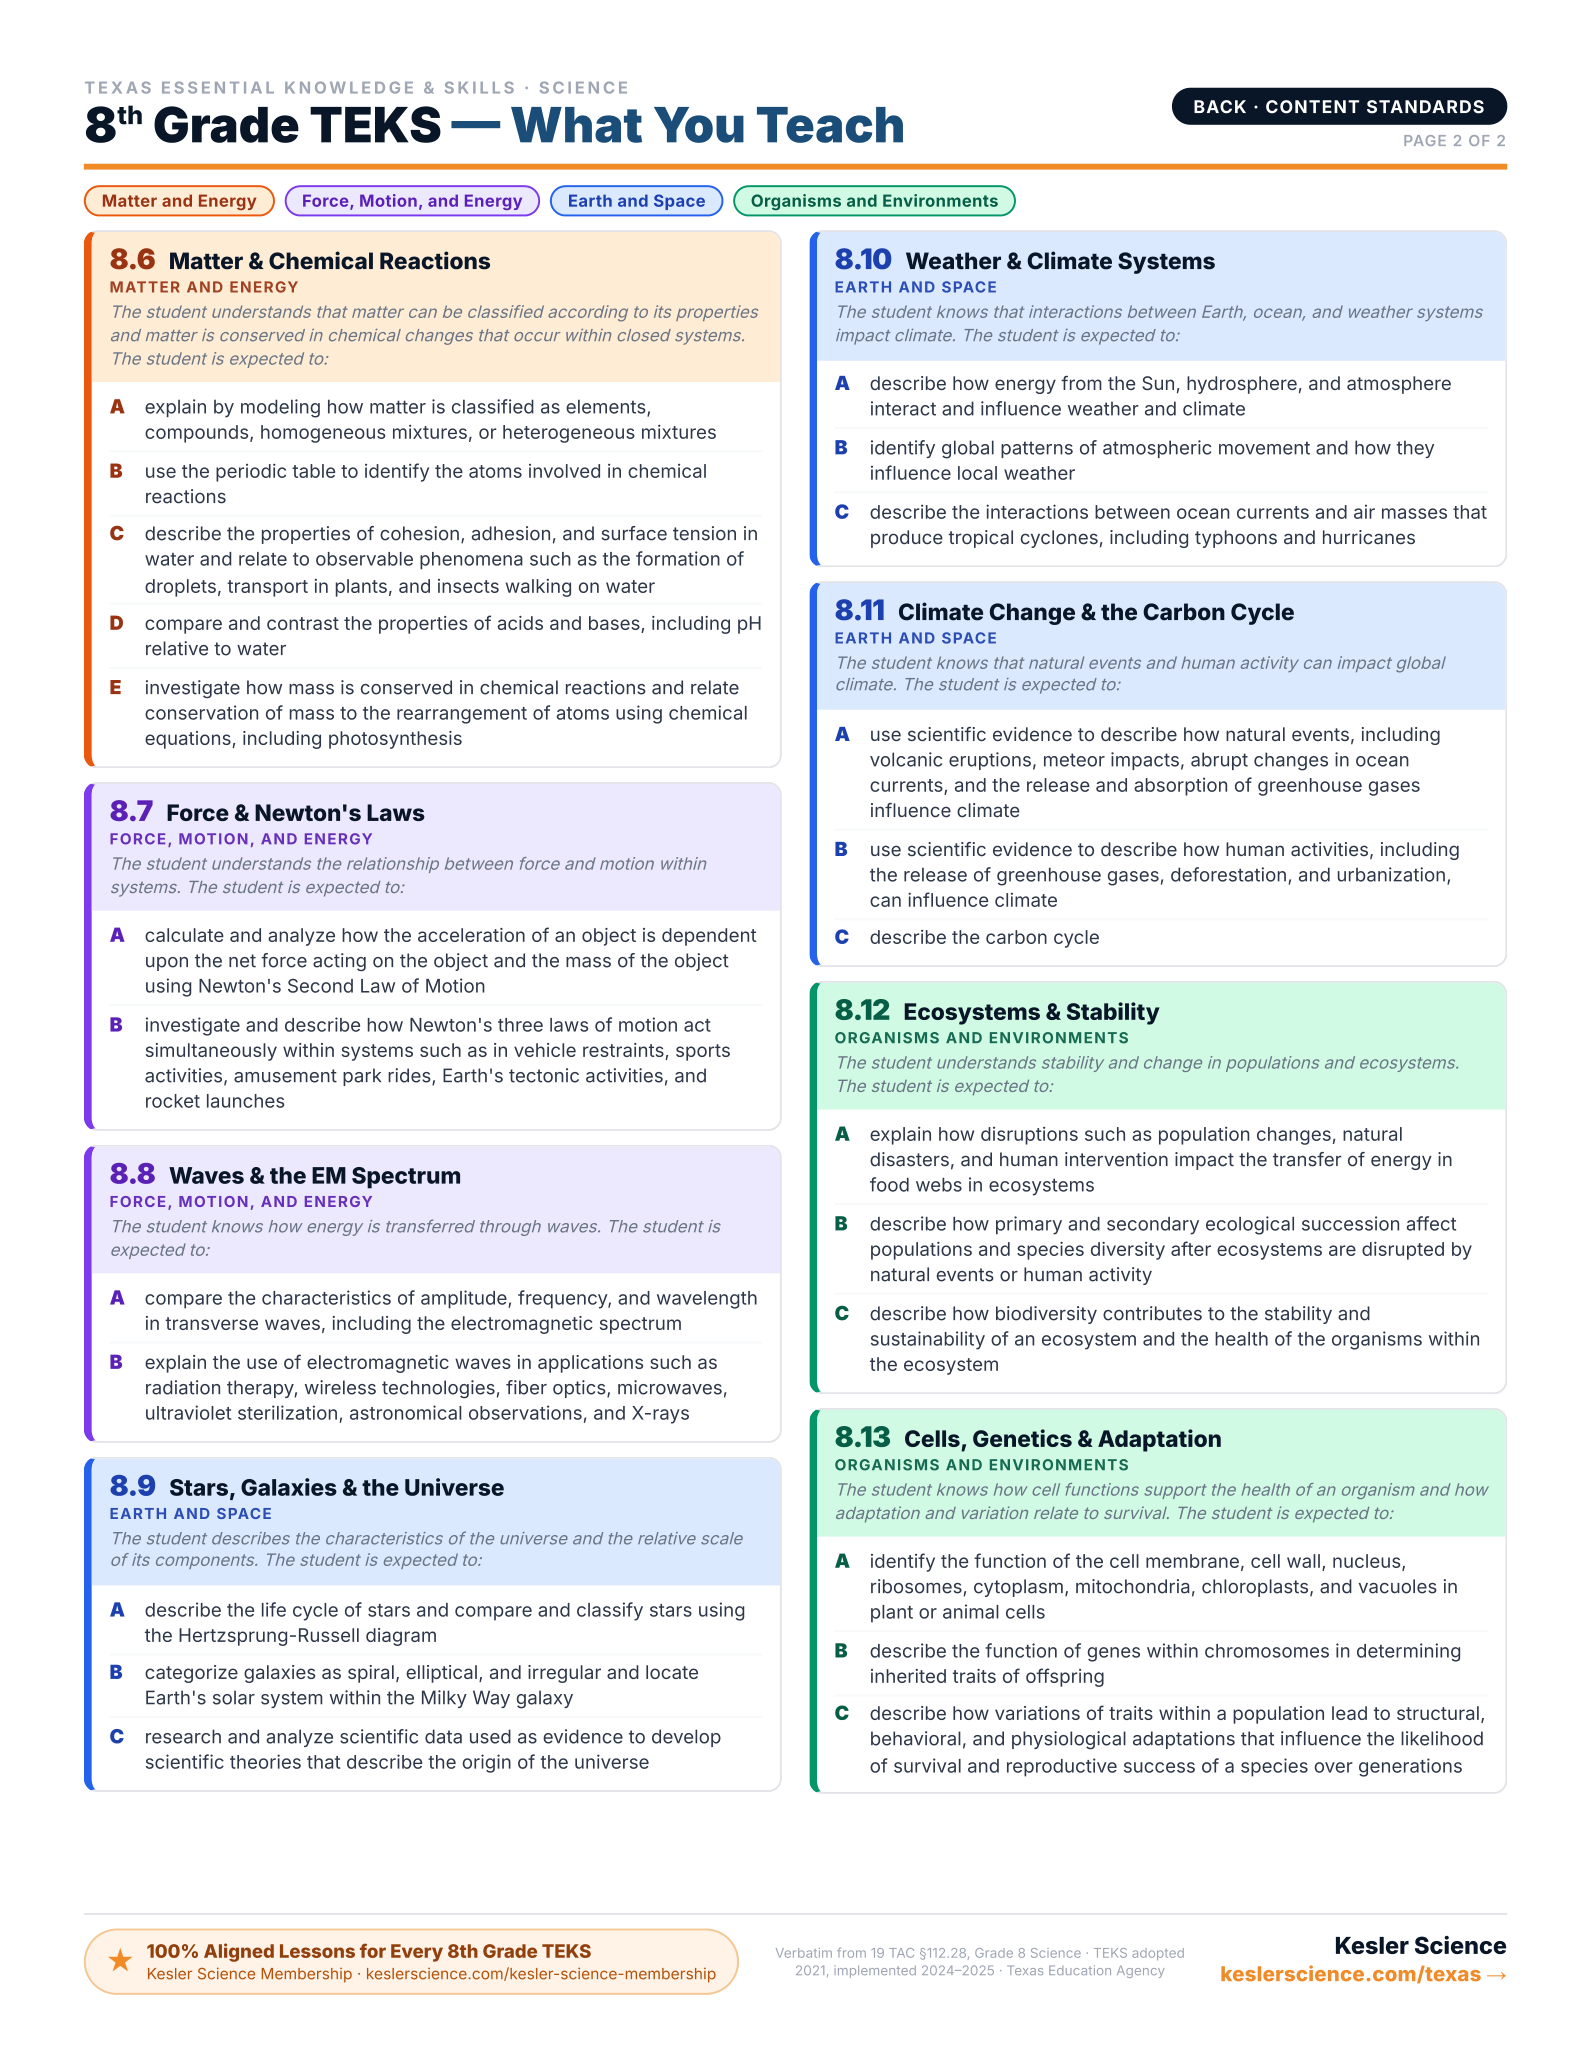
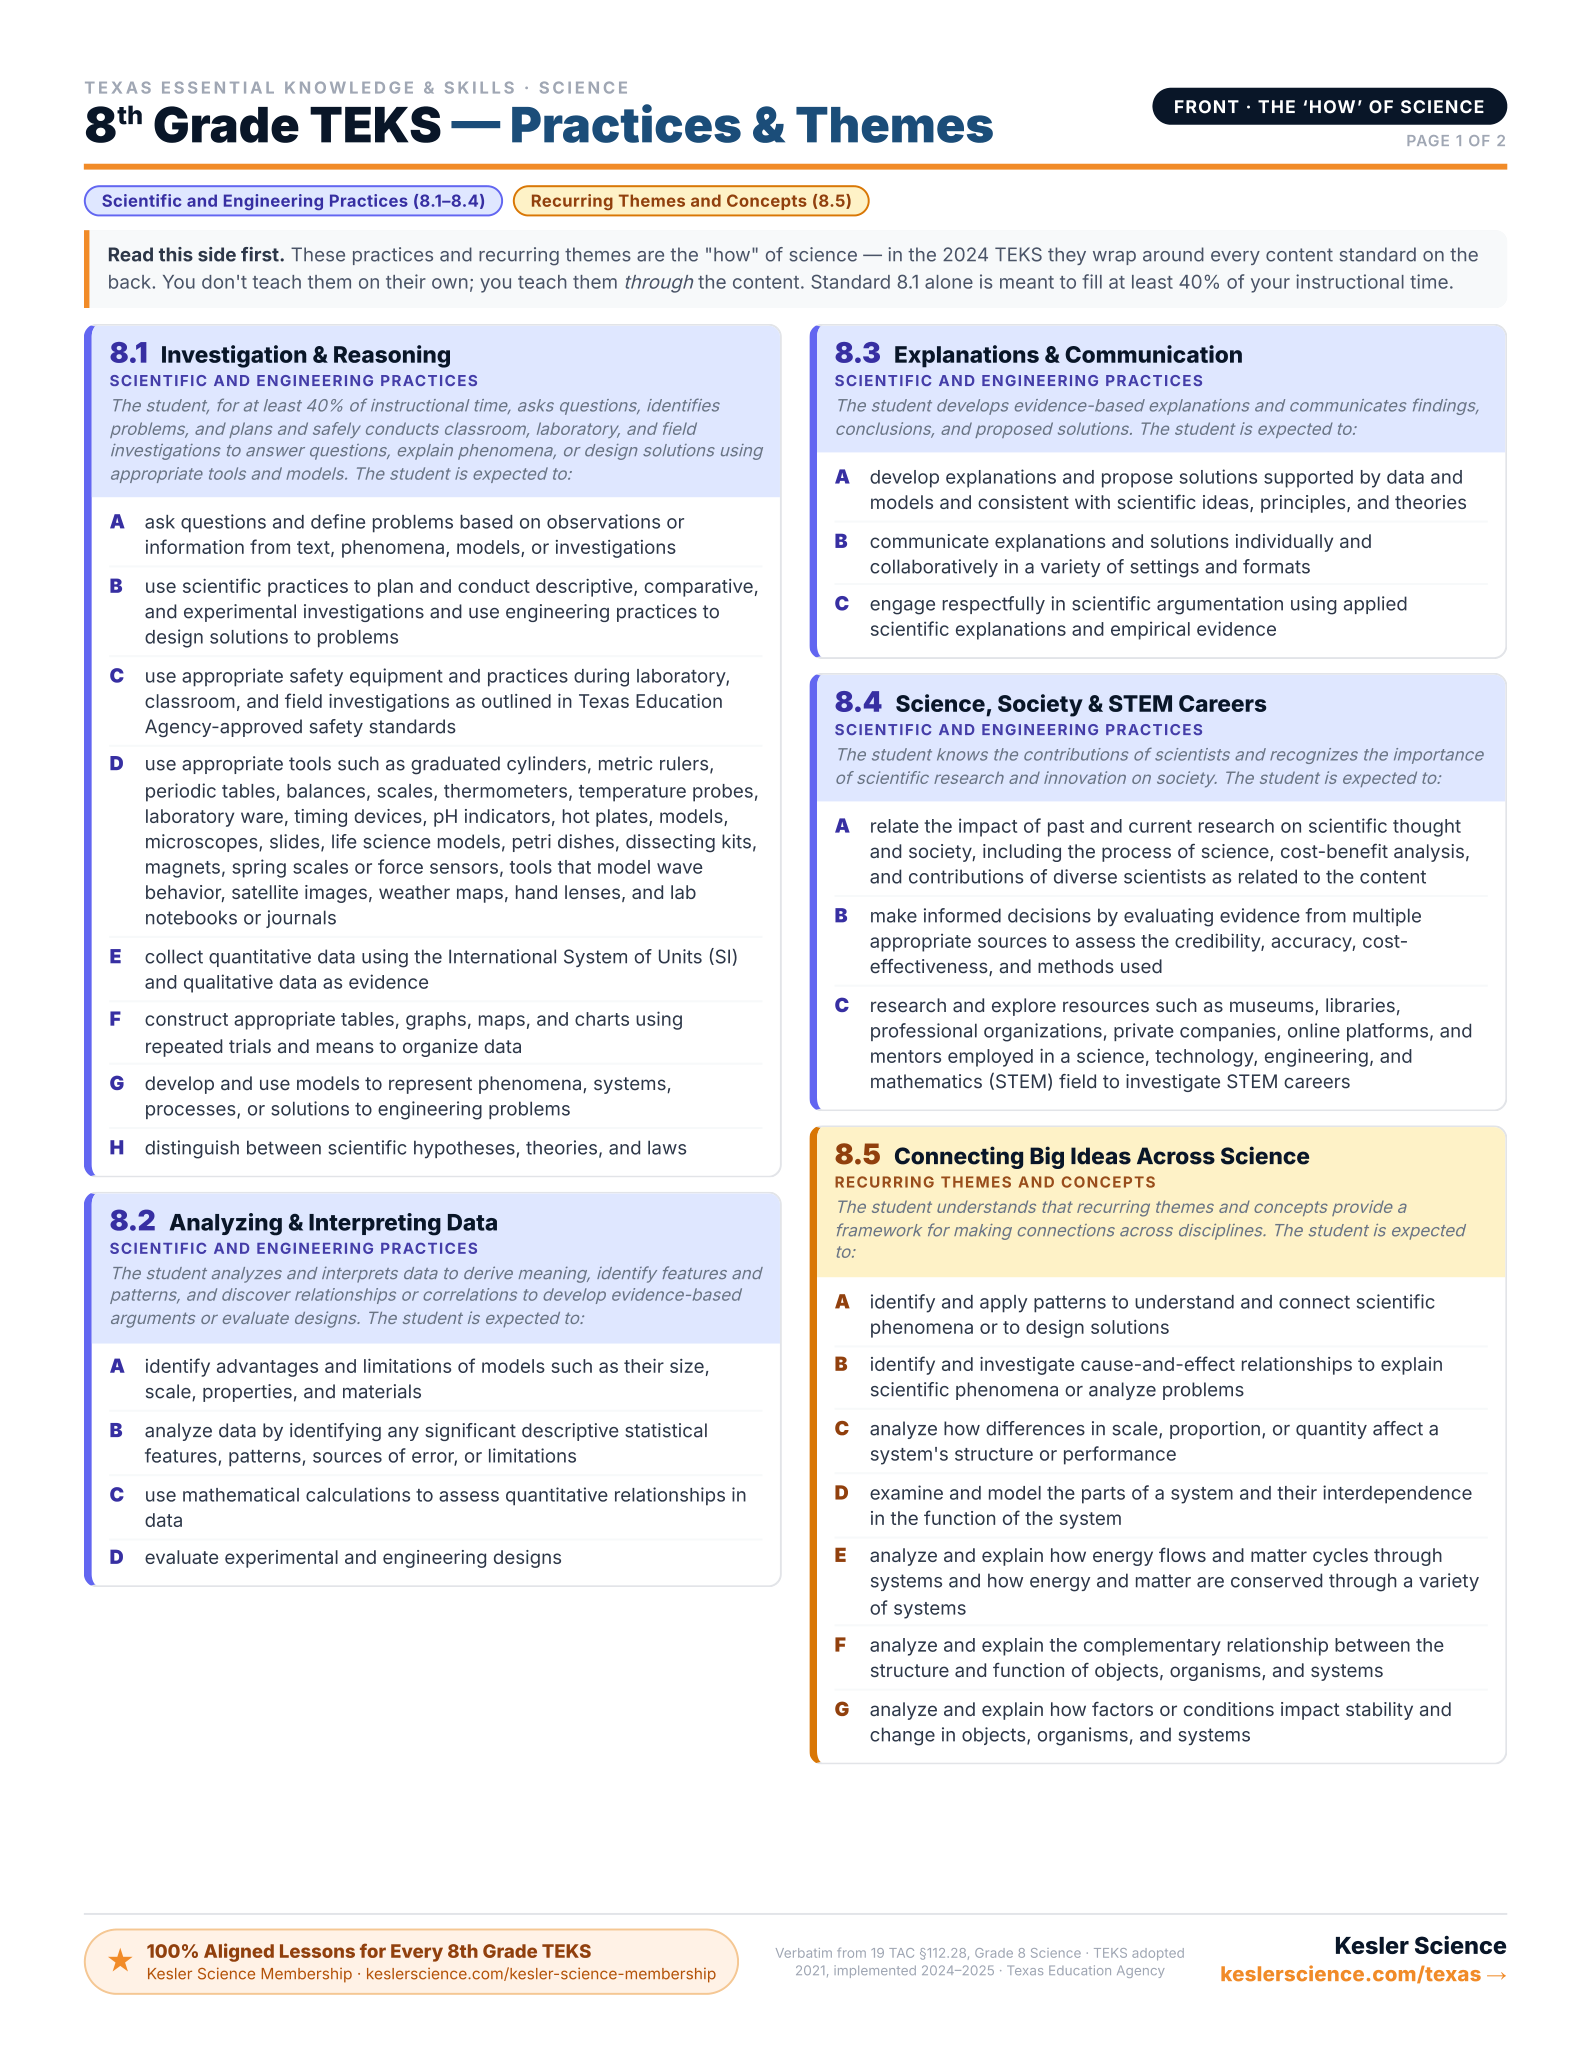
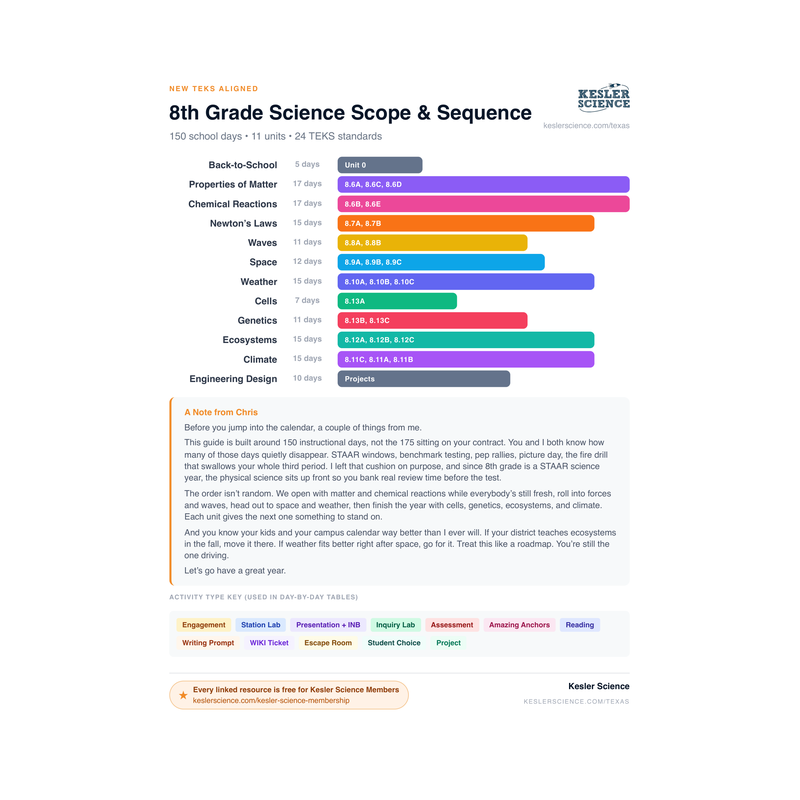
Every 8th-Grade Science TEKS on One Page
The color-coded, front-and-back cheat sheet I wish I'd had — every standard, organized by reporting category. Print it and reference it all year long. This will be your new favorite document!
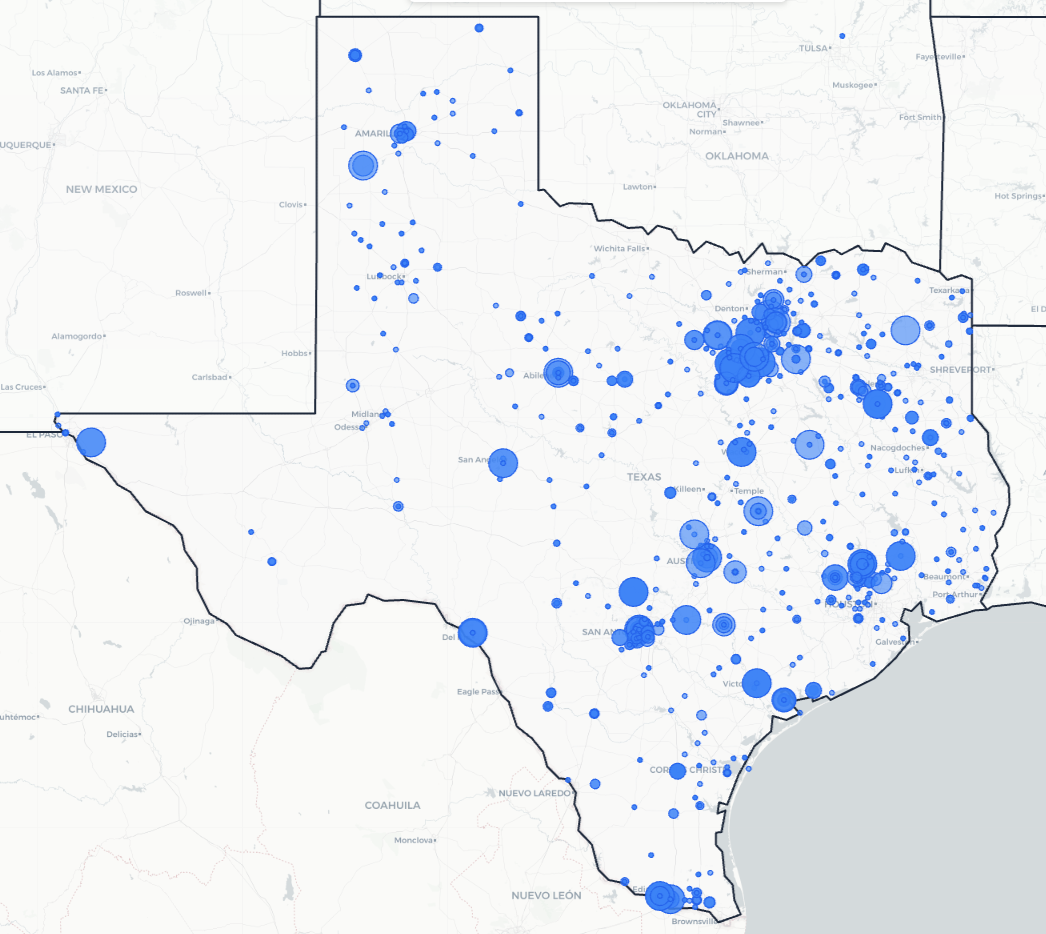
Trusted Across Texas
From the Rio Grande Valley to the Panhandle, Texas science teachers are using Kesler Science to save time and engage students.
Texas Schools and Districts
Love Kesler Science
What Teachers Are Saying
Give Your Science Teachers Everything They Need
School and district licenses give your teachers access to every resource they need, including station labs, inquiry labs, anchoring phenomena, presentations, escape rooms, and much more. One purchase covers the grade levels you need.
- PO-friendly. We accept purchase orders
- Volume discounts for 11+ teachers
- Complimentary membership orientation for 4+ teachers
- Three free implementation PD sessions for departments of 11+
- Aligned to the 2024 TEKS standards
See It in Action
Book a walkthrough and we'll show you how Kesler Science fits your campus.
Book Demo CallNo pressure, no hard sell