
8 hands-on stations for teaching tropical storm formation
A station lab is a student-led activity where small groups rotate through 8 stations (plus a 9th challenge station for early finishers) at their own pace during one to two class periods. You become a facilitator instead of a lecturer. You walk around, spot-check, and break misconceptions while kids work through the rotation.
The Tropical Storms Station Lab has four input stations (where students take in new info on tropical cyclone formation, the three regional names, and storm tracking) and four output stations (where they show what they learned). Here's what's at each one.
4 input stations: how students learn about tropical storms
A short YouTube video walks students through tropical cyclones. Three questions follow: what two other names people use for hurricanes around the world, what conditions allow a tropical cyclone to form, and what's the most dangerous part of a hurricane. Visual learners come alive at this station.
A one-page passage called "The Strongest Storms on Earth" frames it from a Texas-to-India-to-Australia perspective: 80 tropical cyclones a year, the warm-ocean engine that drives them, the three regional names (hurricane, typhoon, cyclone), and the 27-foot Hurricane Katrina storm surge. Three multiple-choice questions follow plus a vocabulary task. Comes in two reading levels (Dependent and Modified) plus a Spanish version.
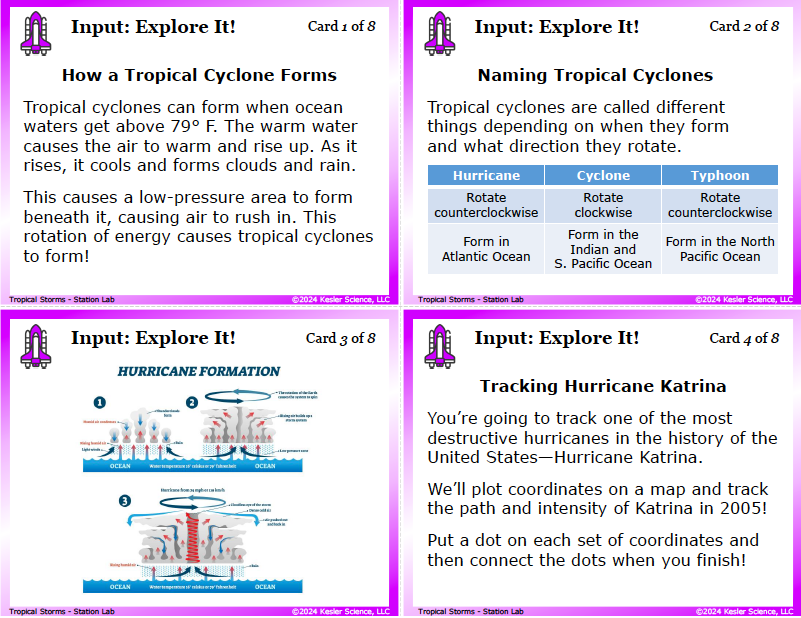
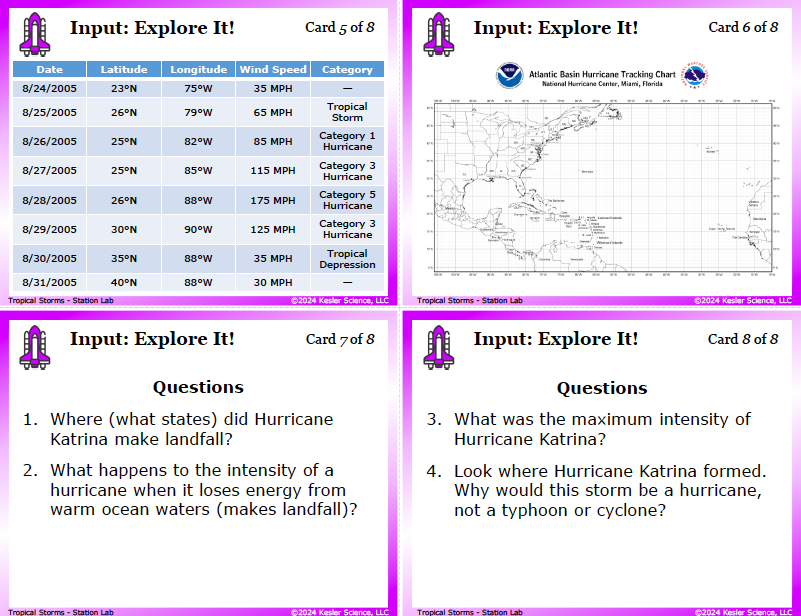
This is the heart of the lab. Students plot the real path of Hurricane Katrina (8/24/2005 to 8/31/2005) on the NOAA Atlantic Basin Hurricane Tracking Chart. Eight latitude/longitude points, with wind speed and Saffir-Simpson category at each one. They watch the storm grow from a 35 mph tropical depression into a 175 mph Category 5 monster, then collapse to a 30 mph low after landfall. Four questions follow: what states Katrina hit, what happens to intensity at landfall, what was the maximum intensity, and why this storm is a hurricane (not a typhoon or cyclone). By the end, they've tracked one of the most destructive storms in U.S. history with their own hands.
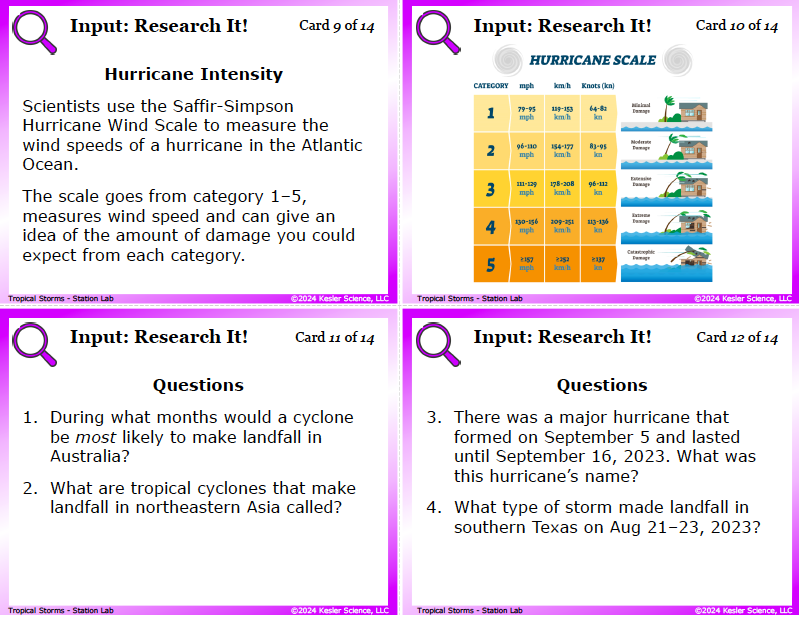
Students examine 14 reference cards covering tropical storm seasons around the world (Atlantic May to November, NW Pacific April to January, Indian Ocean April to December, etc.), the actual 2023 Atlantic hurricane season map, the U.S. hurricane risk map (Texas Gulf Coast and Florida glow red), the NOAA sea-surface-temperature map showing where ocean water hits the 80°F threshold, and the Saffir-Simpson 1–5 scale with damage examples. Eight questions tie it together. The 2023 hurricane map is the kicker; many of your kids will recognize storms they remember.
4 output stations: how students show what they learned
A three-column card sort. Kids match characteristics with one of three storm types: Hurricane (rotate counterclockwise, form in Atlantic Ocean, make landfall in the Americas), Typhoon (rotate counterclockwise, form in Northwestern Pacific Ocean, make landfall in central Asia), or Cyclone (rotate clockwise, form in Indian or Southern Pacific Oceans, make landfall in southern Asia, Australia, and Africa). Easy to spot-check at a glance, and it's the fastest way to see if kids actually got that the three names mean the same kind of storm.
Students sketch a world map and mark where they would find each type of tropical cyclone (hurricanes, typhoons, cyclones). The drawing forces them to commit to the regional naming pattern in a way that fill-in-the-blank doesn't. Even kids who say "I can't draw" surprise themselves here.
Three open-ended questions: what conditions on Earth help create the storms that become tropical cyclones, what are the similarities and differences between hurricanes/typhoons/cyclones, and what dangers tropical cyclones pose to humans. The dangers question is where you'll see if kids learned that storm surge (not wind) does most of the damage.
Eight multiple-choice and fill-in-the-paragraph questions tied to TEKS 8.10C vocabulary (cyclone, hurricane, storm surge, tropical cyclone, typhoon). Includes "which is NOT a factor in tropical storm formation," the cyclone-rotates-clockwise question, and the Saffir-Simpson scale. The fill-in paragraph weaves all five vocabulary words into one connected story. If you're grading the lab, this is the easiest station to grade.
Bonus Challenge It! station for early finishers
Four optional extensions: write an acrostic poem for hurricanes/typhoons/cyclones, design a public service announcement for people about to be hit by a Category 5 hurricane, research a major storm and create an infographic, or design a "wanted poster" for a famous hurricane that hit the U.S. (Katrina, Harvey, Sandy, Ian, etc.). Requires teacher approval before they start.
How this fits into a complete tropical storms unit
This Station Lab is the Explore day of our full Tropical Storms Complete 5E Lesson for TEKS 8.10C. The complete two-week unit follows the 5E method of instruction and includes an Engage hook, the Tropical Storms Station Lab for Explore, PowerPoint slides and interactive notebook pages for Explain, student choice projects to Elaborate, and an Evaluate assessment.
Most teachers grab the full 5E because the Station Lab lands hardest with the days around it. But if you just need a strong hands-on day on tropical cyclone formation and tracking, the Station Lab on its own does the job.

Get this tropical storms activity

Or if you want the full two-week experience with the Engage hook, Explain day, Elaborate extension, and Evaluate assessment all included:
(Station Lab is included)
Frequently asked questions
What does TEKS 8.10C cover?
Texas TEKS 8.10C asks 8th grade students to describe the interactions between ocean currents and air masses that produce tropical cyclones, including typhoons and hurricanes. Students should be able to explain how warm ocean water (about 80°F) drives air masses upward to form a low-pressure system, how the Coriolis effect spins those rising air masses into a rotating storm, and why the same storm goes by different names (hurricane, typhoon, cyclone) depending on where it forms.
What's the difference between a hurricane, a typhoon, and a cyclone?
Location. They're all tropical cyclones. The same kind of storm. Hurricanes form in the Atlantic Ocean and Northeastern Pacific (and hit the Americas). Typhoons form in the Northwestern Pacific (and hit central and East Asia). Cyclones form in the Indian Ocean and South Pacific (and hit southern Asia, Australia, and Africa). Hurricanes and typhoons rotate counterclockwise (Northern Hemisphere); cyclones in the Southern Hemisphere rotate clockwise.
How long does this tropical storms activity take?
One to two class periods (45 to 110 minutes total). Plan for two periods the first time you run a station lab. The Hurricane Katrina plotting at Explore It! is the most time-intensive station. Once your class has the routine down, most groups can finish all 8 stations in one period.
Do I need to provide my own materials?
Almost nothing. The Hurricane Katrina coordinate data, the NOAA Atlantic Basin tracking chart, and all 14 reference cards are included in the download. You'll just need pencils for the Explore It! plotting and colored pencils for the Illustrate It! world map. The Watch It! station also needs a device with internet.
Can I use this in a 1:1 digital classroom?
Yes. The full digital version (PowerPoint or Google Slides) works in 1:1 classrooms and Google Classroom. Students plot the Hurricane Katrina path digitally on the embedded tracking chart instead of with pencil. The hurricane risk map, sea-surface-temperature map, and 2023 hurricane season map all live in the digital slides.