
Texas Science Teacher Resource Hub
Free scope and sequences, TEKS breakdowns, phenomenon ideas, and engagement activities for the 2024 Texas science standards.

🚀 Jump to Your Grade
Pick your grade level and go straight to your TEKS standards, aligned resources, and teaching tools.
-
4th
→4th Grade Science20 standards • Matter, Earth, Energy & more
-
5th
→5th Grade Science19 standards • Matter, Ecosystems, Space & more
-
6th
→6th Grade Science24 standards • Forces, Energy, Matter & more
-
7th
→7th Grade Science27 standards • Cells, Chemistry, Earth & more
-
8th
→8th Grade Science24 standards • Newton's Laws, Space, Genetics & more
7th Grade TEKS Standards
Click any standard to see what it means, how to teach it, where students get stuck, and aligned resources.
Distance-Time Graphs
"Measure, record, and interpret an object’s motion using distance-time graphs."
💡 What This Standard Actually Means
"Measure, record, and interpret". Students are doing three things with an object's motion: measuring distance and time, recording the data, and interpreting what the resulting distance-time graph shows. The new wording emphasizes the full investigation cycle, not just reading a graph that's already drawn. Kids need to gather their own data and then make sense of it visually. Instruction can take many forms, such as ticker tape investigations, motion sensor activities, walking lab data collection, and graph-the-story interpretation challenges.
On a distance-time graph, time goes on the x-axis and distance goes on the y-axis. The slope of the line (how steep it is) tells you the speed of the object. A steeper line means the object is moving faster. A flatter line means it's moving slower. This is the single most important idea in the standard.
A few specific shapes show up over and over. A straight line with a steady slope means constant speed. A horizontal line means the object is at rest (distance isn't changing, but time keeps going). A curved line means the speed is changing, which is acceleration. Steep to flat to steep again tells a story of an object speeding up, slowing down, and speeding back up.
One spot where students often trip up: a line sloping downward on a distance-time graph does not mean the object is moving backward in time. It usually means the object is returning toward its starting point. The distance from the start is decreasing. Time keeps moving forward on the x-axis. Students need to understand that reading the graph left to right is always reading forward through time.
The trick that unlocked this for my students was teaching them to narrate the graph. I'd put a distance-time graph on the board with three sections: a climb, a flat spot, and a steeper climb. I'd say, "Tell me the story of this person walking to school." And they'd narrate it out loud. "They walked steadily. Then they stopped at the crosswalk. Then they jogged the rest of the way." Once students started translating graphs into stories, they stopped being intimidated by them. It turns every graph into a movie they can describe, and that makes the analysis piece a whole lot less abstract.
⚠️ Misconceptions Your Students May Have
These are some of the most common misconceptions. Knowing what to look for can help you get ahead of them.
"A distance-time graph shows the path the object took"
Students sometimes read a graph like a map, as if the shape of the line is the shape of the path. It's not. A distance-time graph shows how far from the start an object is at different moments. A straight, steep line could describe a person running in a perfectly straight hallway or a runner on a circular track. The graph is about distance covered over time, not the physical route.
"A horizontal line means the object is moving at a constant speed"
A horizontal line on a distance-time graph means the distance isn't changing. That means the object is at rest. Time is still moving forward on the x-axis, but the object isn't covering any new distance. Constant speed shows up as a straight line with a slope that isn't zero.
"A downward slope means the object is going backward in time"
Time never runs backward on a distance-time graph. The x-axis always moves forward. A downward slope usually means the object is moving back toward its starting point, so its distance from the start is decreasing. Time keeps going. The object is simply heading home.
"Steeper lines mean the object traveled farther"
Steeper lines mean the object is moving faster, not that it covered more total distance. A very steep line over a short amount of time might describe a quick sprint across the room. A shallow line over a long amount of time could cover way more ground. Students should look at the slope for speed and the total height of the line for distance.
📓 Teaching Resources for 7.7C
These resources are aligned to this standard.


100% Aligned Lessons for Every TEKS You Teach
The membership gives you access to thousands of lessons and activities designed to boost student engagement and reclaim valuable teaching time. Trusted by schools and districts all over the great state of Texas.
🌎 Phenomenon Ideas for 7.7C
Use these real-world phenomena to anchor your lesson. Show students the phenomenon first, let them wonder, then build toward Distance-Time Graphs as the explanation.
The Walk to School That Becomes a Graph
A student walks to school each morning. They start at a steady pace, stop for a minute at the crosswalk, speed up once they cross the street because they're running late, then walk slowly through the hallway to their locker. If we tracked that whole trip as a distance-time graph, we'd get a shape with several different sections. Every one of those sections would look different.
"What would the graph look like for the student's steady walk? For the pause at the crosswalk? For the sudden sprint? How does the slope of each section tell us something different about the walk?"
A Bus Stuck in City Traffic
A city bus drives its normal route through downtown. It moves steadily for a block, stops at a red light, inches forward at a traffic jam, stops again to pick up passengers, then cruises on the open stretch between stops. If you drew a distance-time graph of the bus's trip, you'd see a shape that goes up, then flattens out, then climbs a tiny bit, then flattens, then climbs steeply.
"Which sections of the bus's graph would be horizontal lines? Which sections would be the steepest? If I showed you only the graph without knowing it was a bus, could you tell me roughly what was happening to the bus at each section?"
A Runner Going Out and Coming Back
A runner leaves her front porch, jogs a mile to the park, takes a breather on a bench for five minutes, then runs a mile back to her house. If we graph her distance from home on the y-axis and time on the x-axis, the line climbs, flattens out during the break, and then slopes downward all the way back to zero. The line never goes back in time. Time keeps going. She just ends up back at the starting distance.
"Why does the line on the graph slope downward on her way home instead of continuing to climb upward? What is the downward slope actually showing us about her motion?"
💡 Free Engagement Ideas for 7.7C
The Human Graph Activity
Tape a number line on the classroom floor from 0 to 10 meters. Have a student walk the line while a partner calls out their position every 2 seconds. Plot the data on a distance-time graph as it's collected. Do different walking styles (steady walk, stop-and-go, backward trip) and compare the graphs. Students see the slope change in real time as the walker changes pace.
Graph Matching Gallery Walk
Post 10 distance-time graphs around the room. Next to each, tape a blank index card. Students walk around, look at each graph, and write on the card what "story" the graph tells (someone running steadily, someone stopping for a break, someone walking home after running away from home). Debrief as a class. Great for quick assessment of interpretation skills.
Toy Car Data Collection
Give each group a wind-up or pull-back toy car and a meter stick. Release the car and mark its position every second (a partner calls "now" each second while another student marks where the car is). Record distance vs. time and plot the graph. Since the car slows down as it runs out of energy, students see a curve rather than a straight line, a great intro to changing speed.
Create-the-Graph Storytelling
Hand out a sheet with blank x/y axes and a short story: "Jesse leaves home, walks slowly to the bus stop, waits 2 minutes, then rides the bus quickly to school." Students sketch the distance-time graph that matches. Then they write their own story and trade with a partner, who sketches the matching graph. Connects interpretation and creation in a low-tech way.
🎯 What Approaches, Meets, and Masters Thinking Look Like
Here is what student thinking at each level looks like on this one task, so you know what to look for and how to move a student up.
Maria rides her bike to a friend's house. Here is her distance-time graph. First, the line goes up in a steady, steep slope. Then the line goes flat (horizontal) for a while. Then it goes up again with a less steep slope. Describe what Maria's bike is doing during each of the three parts of the trip, and explain how the graph tells you.
- A separate description for each of the three parts of the graph, not just one overall answer.
- The first steep slope read as the bike moving, and moving fast, because distance is going up quickly.
- The flat (horizontal) part read as the bike stopped, because distance is not changing while time keeps going.
- The third, less steep slope read as the bike moving again, but slower than the first part.
- An explanation that ties the answer to the graph: steeper means faster, flat means stopped, and reading left to right means time is moving forward.
- A clear connection between how steep the line is and how fast the bike is going (slope shows speed).
- The flat part handled correctly as stopped, not as moving at a steady speed. That is the easiest place to slip.
In the first part the bike is going fast because the line goes up steep. In the last part the bike is going slower because the line is not as steep. In the middle part the line is flat, so the bike is going at a steady speed that whole time. Then it speeds back up at the end.
In the first part the bike is moving fast. The line goes up steep, so the distance is going up quick, which means high speed. In the middle the line is flat. The distance stays the same but time keeps going, so the bike is stopped, maybe resting. In the last part the line goes up again but it is not as steep, so the bike is moving again but slower than the first part.
First part: the bike moves fast, because the steep line means a lot of distance is covered in a little bit of time. Middle part: the bike is stopped, because the line is flat, so the distance is not changing even though time keeps moving forward. Last part: the bike moves again but slower, because the line goes up at a gentler slope. The real rule is that the slope tells you the speed. Steeper means faster, flat means stopped.
That same rule works for any distance-time graph, even ones that go back down. If Maria's line started sloping downward later, it would not mean she is going back in time. Time always keeps going left to right. A downward slope would just mean her distance from home is getting smaller, so she is riding back toward where she started.
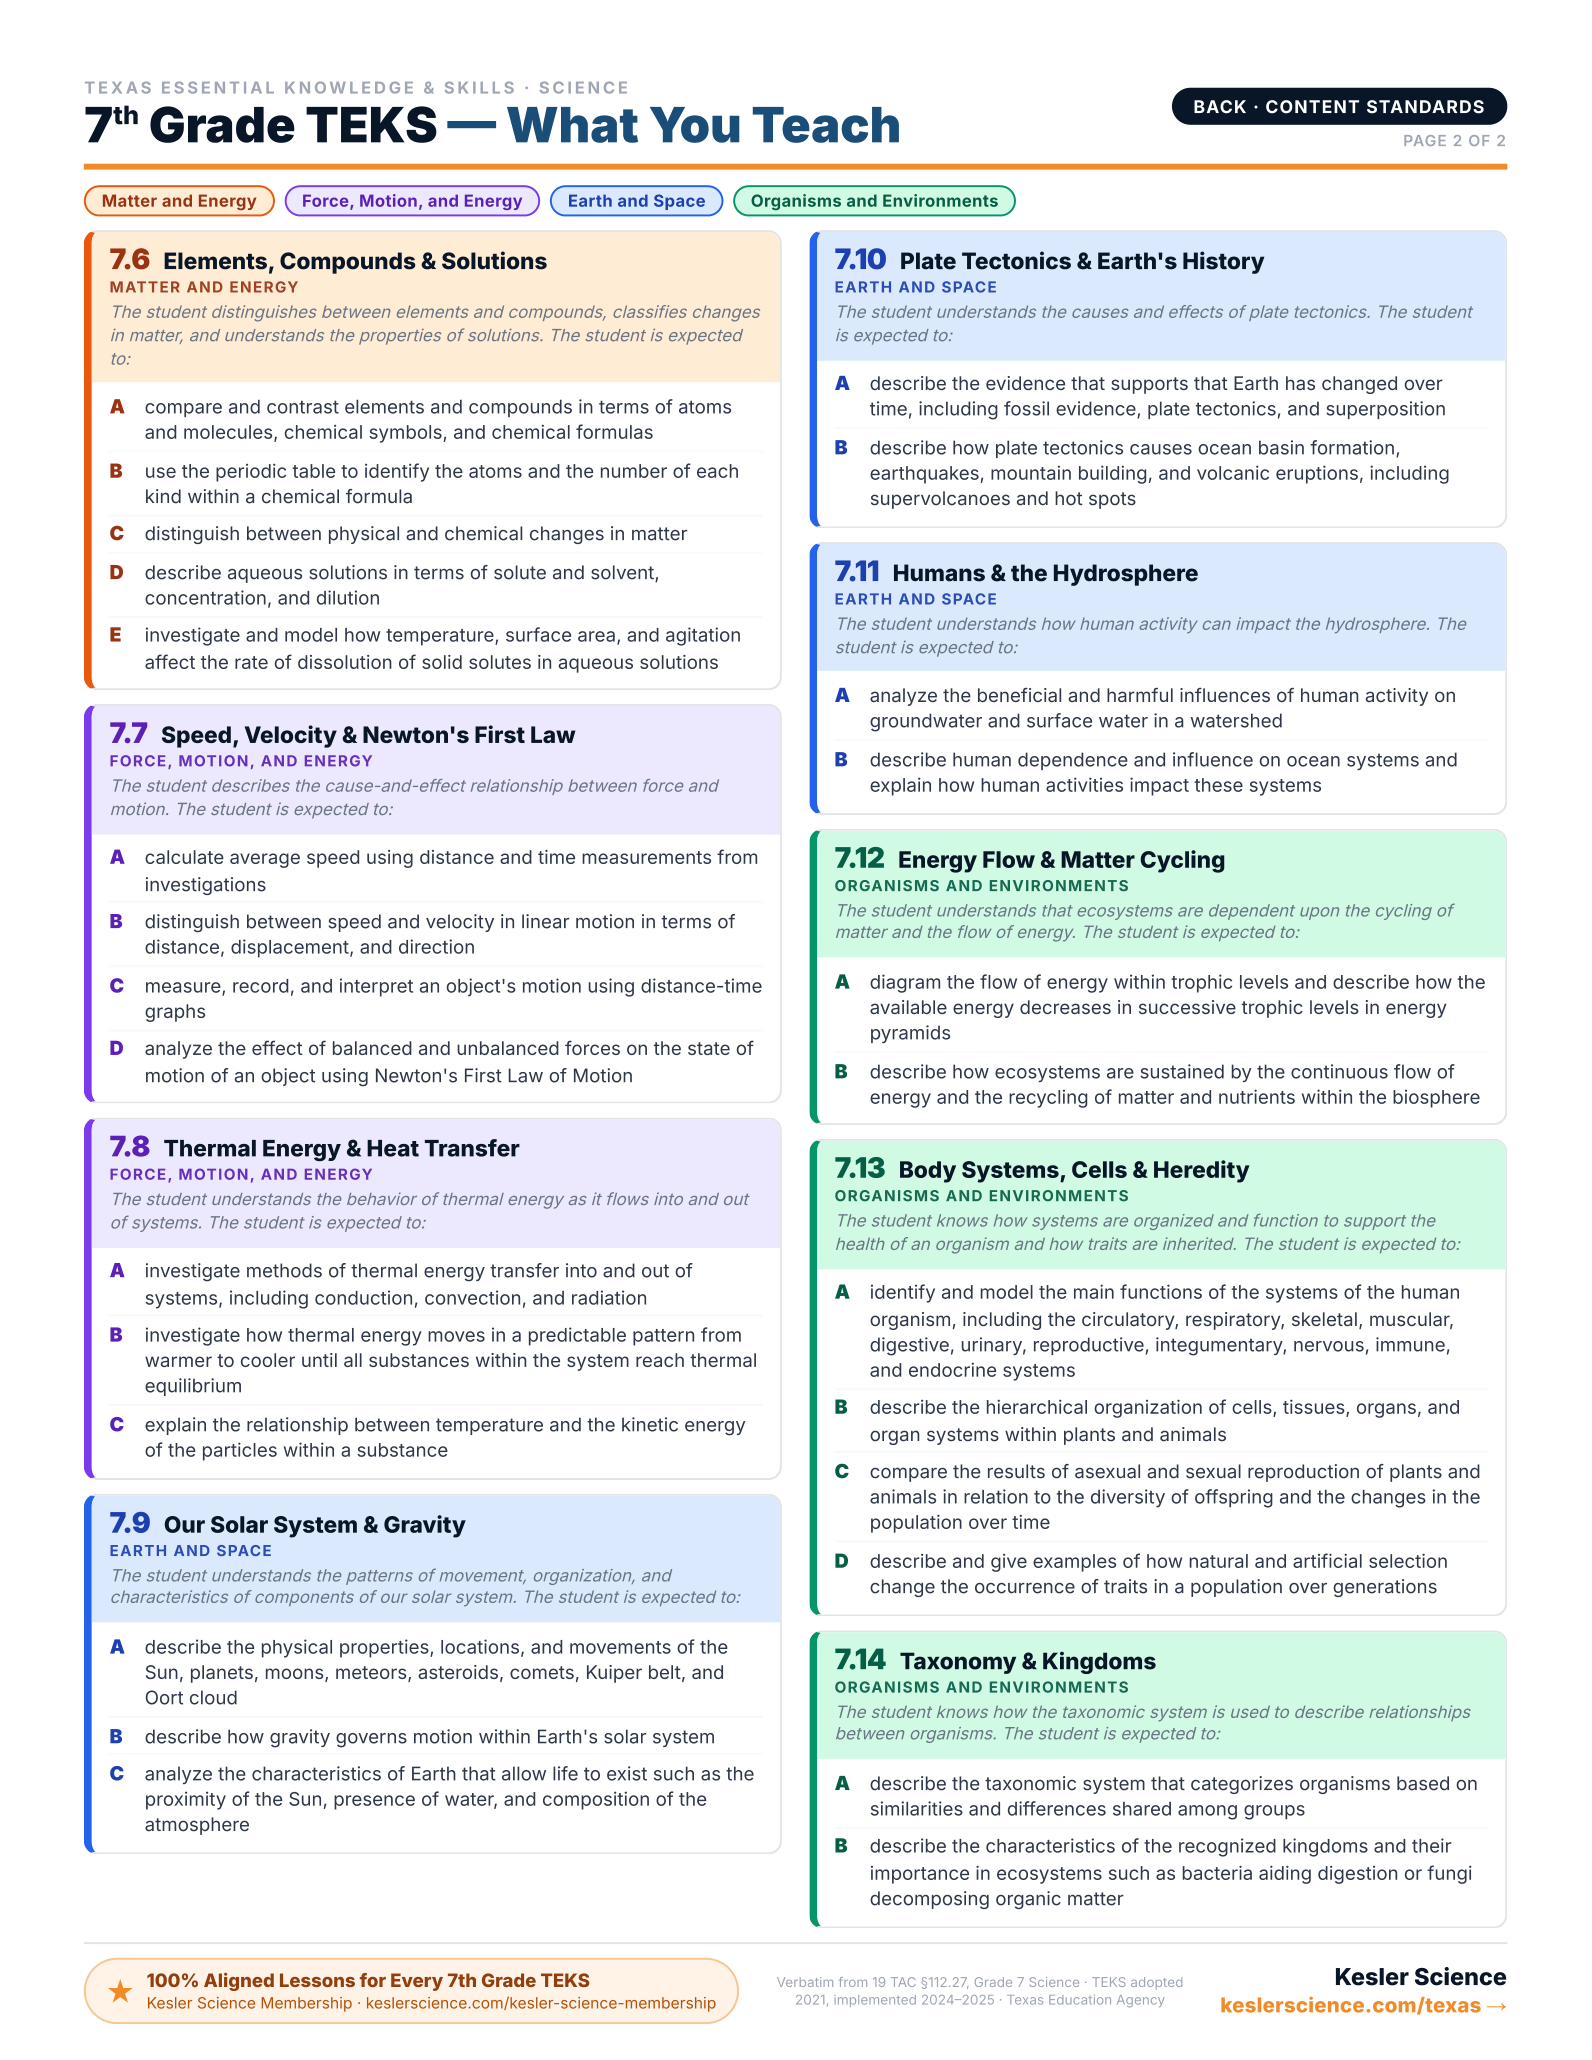
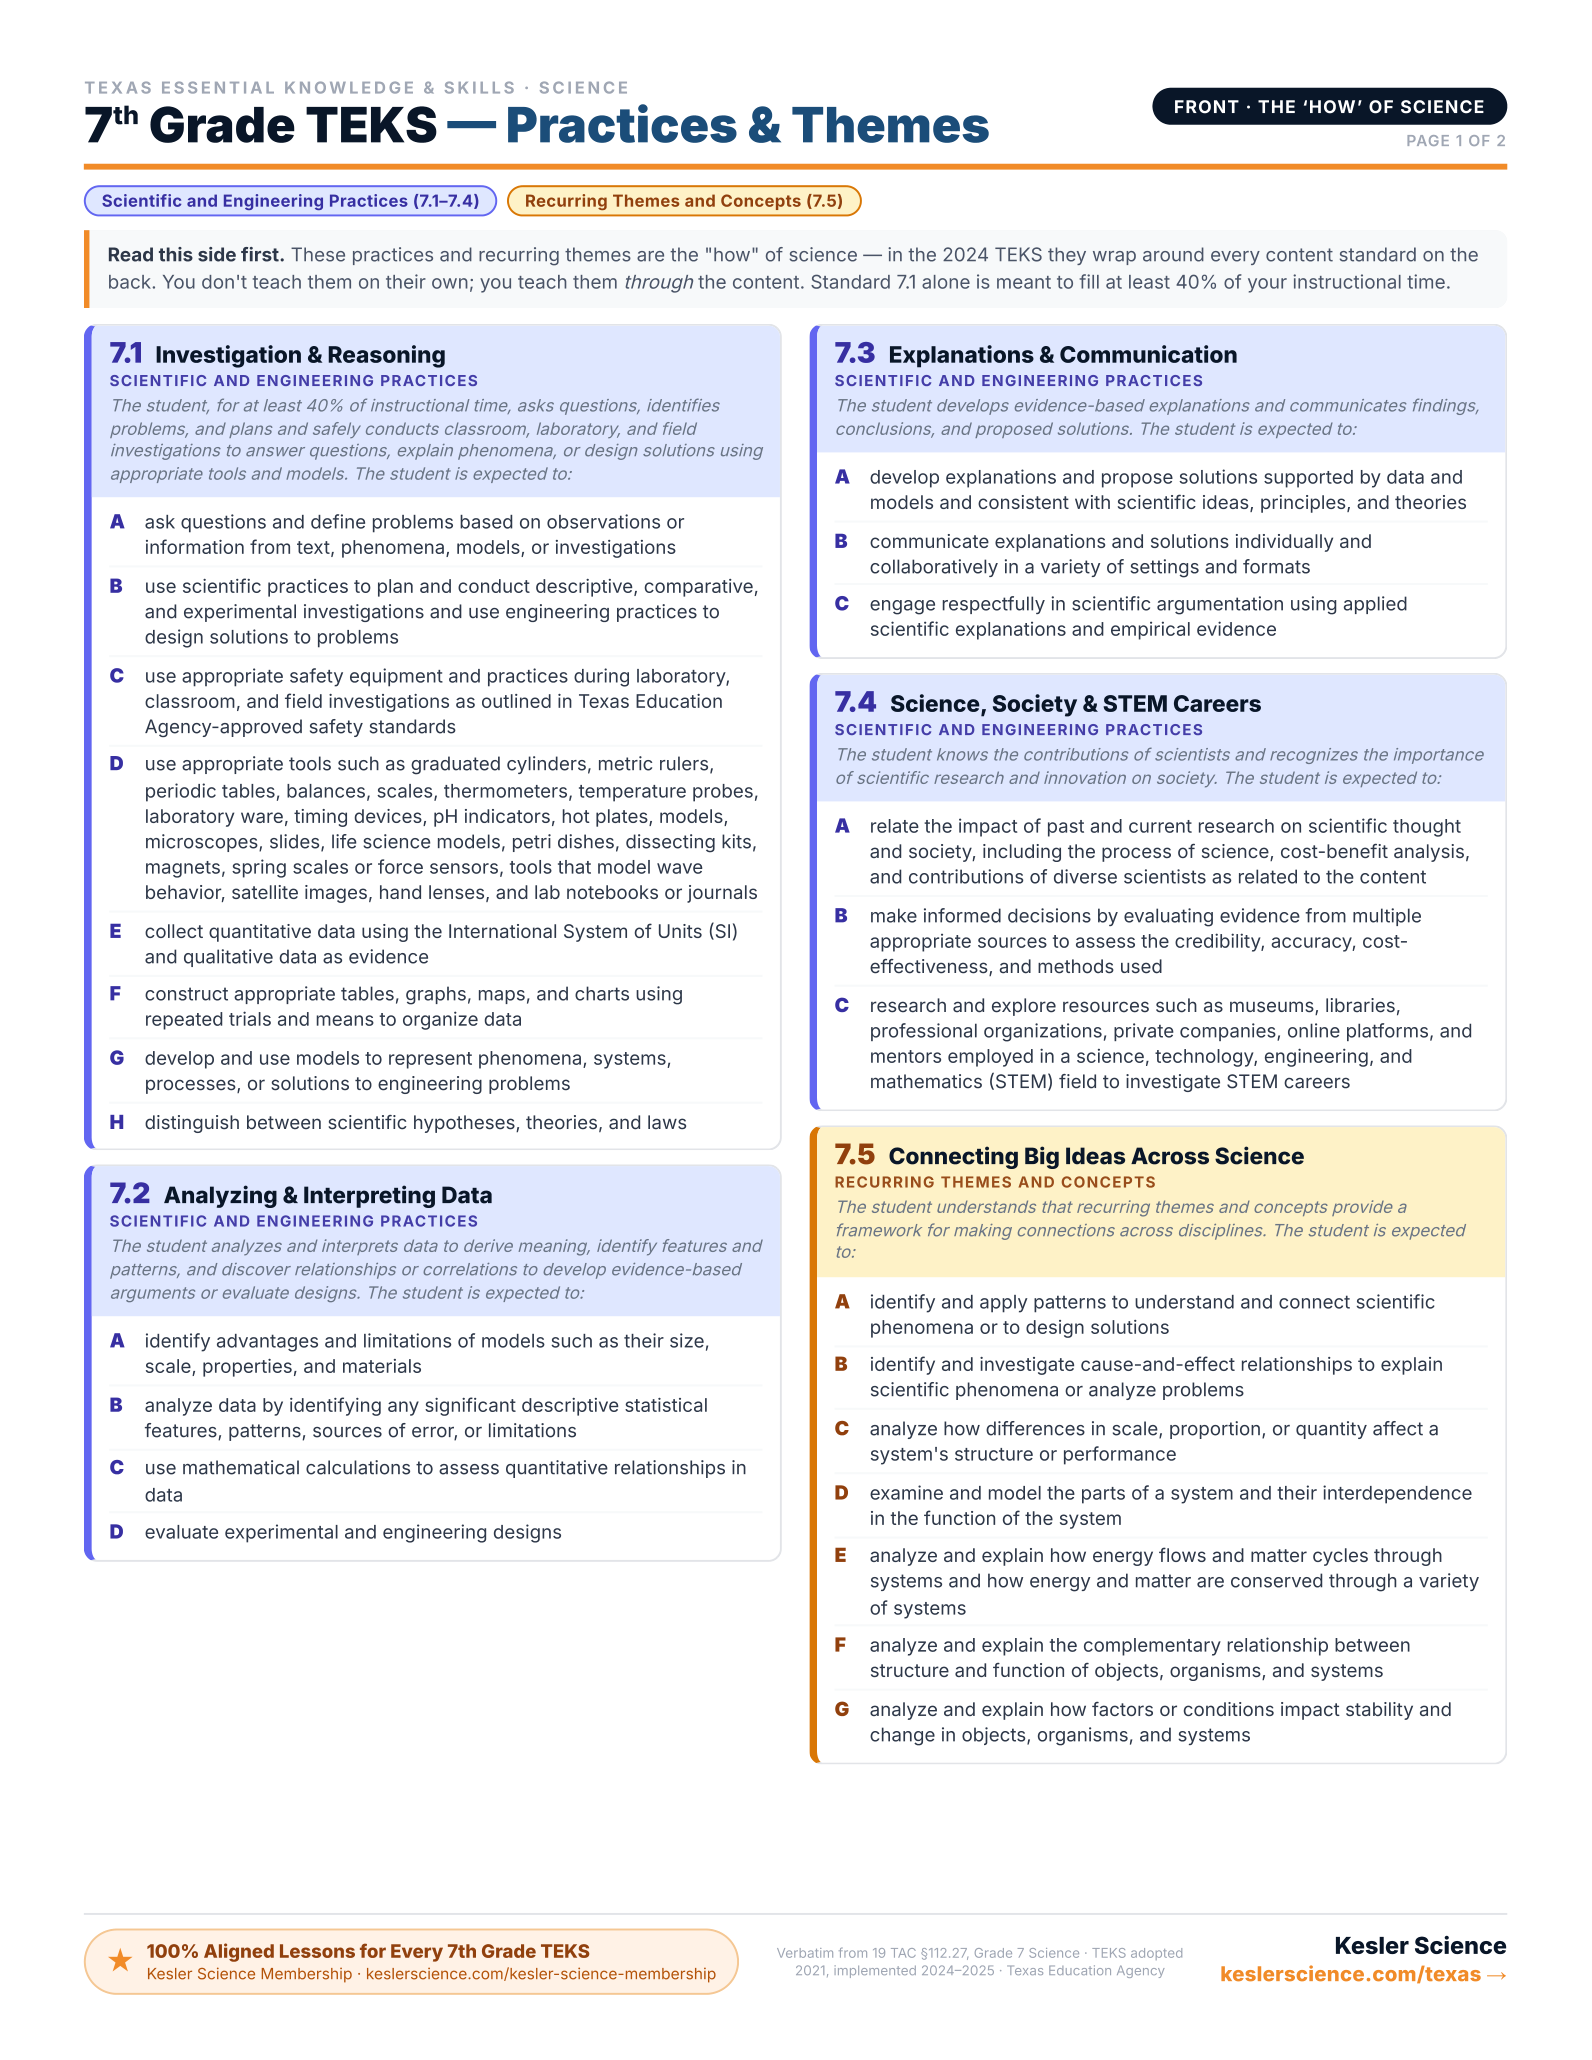
Every 7th-Grade Science TEKS on One Page
The color-coded, front-and-back cheat sheet I wish I'd had — every standard, organized by reporting category. Print it and reference it all year long. This will be your new favorite document!
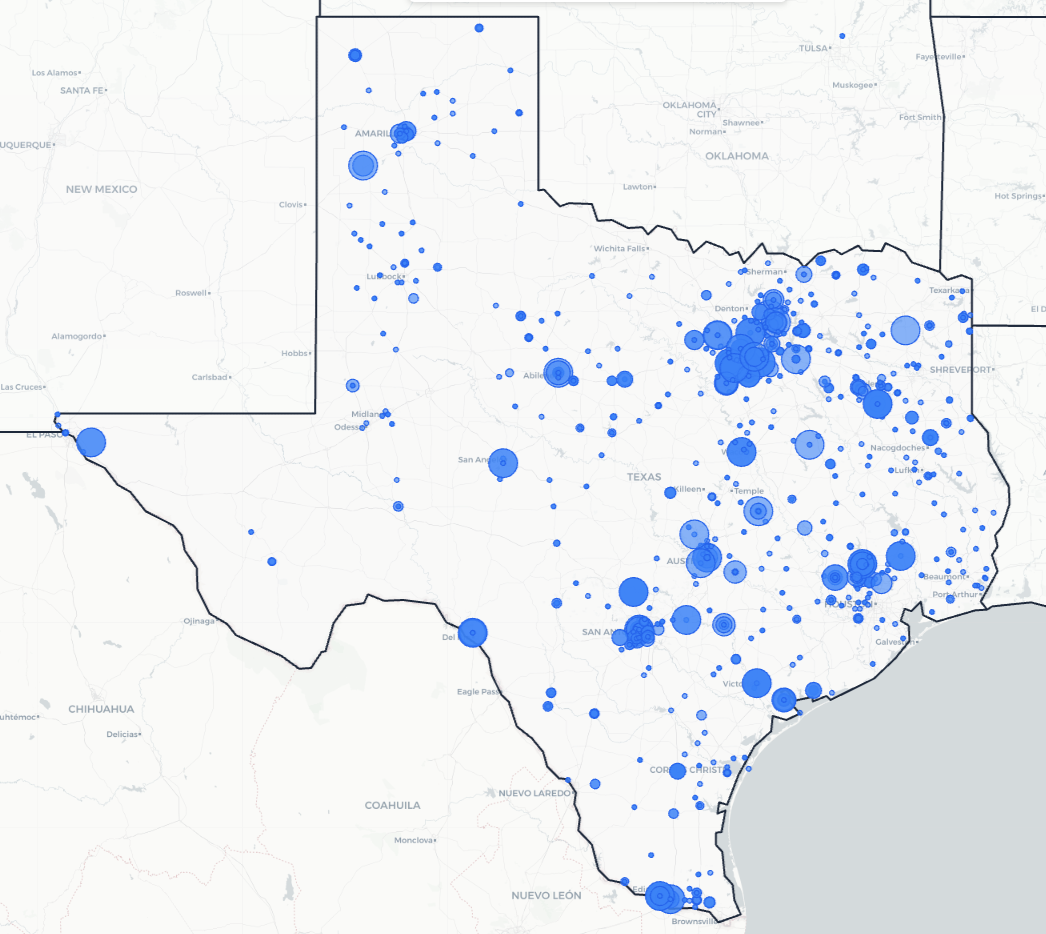
Trusted Across Texas
From the Rio Grande Valley to the Panhandle, Texas science teachers are using Kesler Science to save time and engage students.
Texas Schools and Districts
Love Kesler Science
What Teachers Are Saying
Give Your Science Teachers Everything They Need
School and district licenses give your teachers access to every resource they need, including station labs, inquiry labs, anchoring phenomena, presentations, escape rooms, and much more. One purchase covers the grade levels you need.
- PO-friendly. We accept purchase orders
- Volume discounts for 11+ teachers
- Complimentary membership orientation for 4+ teachers
- Three free implementation PD sessions for departments of 11+
- Aligned to the 2024 TEKS standards

See It in Action
Book a walkthrough and we'll show you how Kesler Science fits your campus.
Book Demo CallNo pressure, no hard sell