.png?width=375&height=100&name=WebPage%20logo%20with%20curves%202026%20(8).png)
NGSS Resource Hub
Three-dimensional breakdowns, phenomena, and classroom-ready activities for every NGSS standard, grades 4-8.

🚀 Jump to Your Discipline
5th Grade NGSS Standards
Pick any standard. Each page is your full lesson-planning workspace for that standard.
Observable Patterns of the Sky: Graphing Shadows, Day and Night, and the Stars That Come and Go
"Represent data in graphical displays to reveal patterns of daily changes in length and direction of shadows, day and night, and the seasonal appearance of some stars in the night sky."
NGSS Lead States. (2013). Next Generation Science Standards: For states, by states (5-ESS1-2). The National Academies Press. https://www.nextgenscience.org/dci-arrangement/5-ess1-earths-place-universe
Students look for patterns such as how Earth's position and movement relative to the sun, and to certain stars that appear only during specific months, create regular changes we can observe.
Summarized in our own words from the 5-ESS1-2 clarification statement (NGSS Lead States, 2013). Not a verbatim quote.
Students are not expected to explain what causes the seasons.
Summarized in our own words from the 5-ESS1-2 assessment boundary (NGSS Lead States, 2013). Not a verbatim quote.
The three dimensions packed into this standard
Every standard bundles a DCI (the content), a SEP (the science practice), and a CCC (the crosscutting lens). They run in the same task, not in sequence.
"The orbits of Earth around the sun and of the moon around Earth, together with the rotation of Earth about an axis between its North and South poles, cause observable patterns. These include day and night; daily changes in the length and direction of shadows; and different positions of the sun, moon, and stars at different times of the day, month, and year."
National Research Council. (2012). A framework for K-12 science education: Practices, crosscutting concepts, and core ideas. The National Academies Press. https://doi.org/10.17226/13165
This whole standard lives in one move: 5th graders take real sky data and turn it into a graph that makes a pattern jump out. They measure how a shadow shrinks and stretches through a day. They chart how many hours of daylight a date gets. They list which stars show up in which months. Once it is graphed, the pattern is impossible to miss. The sky is not random. It repeats.
"Represent data in graphical displays (bar graphs, pictographs and/or pie charts) to reveal patterns that indicate relationships."
National Research Council. (2012). A framework for K-12 science education. The National Academies Press.
5th graders are ready to graph, and this standard expects it. Instead of being told the pattern exists, 5th graders build the bar graph or pictograph themselves, then read it to spot the repeat. The skill is turning a messy list of measurements into a picture that shows the trend at a glance.
"Similarities and differences in patterns can be used to sort, classify, communicate and analyze simple rates of change for natural phenomena."
National Research Council. (2012). A framework for K-12 science education. The National Academies Press.
This is the big idea 5th graders carry out the door: the sky changes on a schedule. Shadows change length all day, the same way, every day. Daylight stretches and shrinks across the year, the same way, every year. Once you see the repeat, you can predict what comes next.
📍 Where This Standard Fits in the K-12 Progression
Use this to plan the year. Knowing what students should already know and what they're heading toward keeps the lesson focused.
5th graders arrive having already watched the sky in 1st grade. Back then they used observations of the sun, moon, and stars to describe patterns that can be predicted. They noticed the sun rises and sets and that stars are seen at night. They have not yet measured those patterns or turned them into graphs.
Observable Patterns of the Sky: Graphing Shadows, Day and Night, and the Stars That Come and Go
In middle school, students build a model of the Earth-sun-moon system to explain the patterns they only graphed in 5th grade. They start explaining the actual cause of day and night, moon phases, and eclipses, the very causes 5th grade leaves out.
🌎 Phenomena for 5-ESS1-2
Anchor the lesson in one puzzling phenomenon kids keep coming back to. Use the two investigative phenomena to sharpen specific facets.
The Shadow That Won't Hold Still
Tape a stick upright in the schoolyard and trace its shadow every hour. By the end of the day the chalk marks fan out like spokes on a wheel. The shadow was long and pointing one way in the morning, tiny at midday, then long again pointing the other way by afternoon. The stick never moved. So what made the shadow swing all the way around and shrink in the middle?
"The stick never moved all day, so why did its shadow keep changing length and direction?"
- "Why is the shadow shortest right around the middle of the day?"
- "Would the shadow do the exact same thing tomorrow, or is every day different?"
- "If we graphed the shadow length each hour, what shape would the graph make?"
The Daylight Is Sneaking Longer
Hand 5th graders the sunrise and sunset times for the first of every month from a calendar or weather site. They subtract to find the hours of daylight and build a bar graph, month by month. The bars are short in winter, tall in summer, then short again. Same swing as the shadow, but stretched across a whole year. The sky changes on a schedule you can chart.
"Why does the number of daylight hours keep changing month to month instead of staying the same?"
- "Which month gets the most daylight, and which gets the least?"
- "Does the pattern repeat next year, or is it different every time?"
- "Could we use the graph to predict the daylight hours for a month we didn't measure?"
The Stars That Disappear for the Season
Show 5th graders a simple star chart for the same place in January, then in July. Some bright stars and constellations are missing from one and back in the other. Orion blazes in winter and is gone by summer. Have them tally which months each star shows up and graph it. Same idea as the shadow and the daylight: a repeat you can see once it is on paper.
"Why can we see certain stars only during certain months and not others?"
- "Are the missing stars gone forever, or do they come back?"
- "Could we predict which stars we'll see three months from now?"
- "Why do some stars stay up all year while others come and go?"
100% Aligned Lessons for Every NGSS Standard You Teach
The membership gives you access to thousands of lessons and activities designed to boost student engagement and reclaim valuable teaching time. Trusted by schools and districts from every NGSS state.
⚠️ Misconceptions Your Students Will Walk In With
These come up almost every year. Knowing them in advance lets you head them off in the first lesson.
"The sun moves across the sky, so the sun is what changes the shadow."
It looks like the sun travels across the sky, and that's a fair thing to notice. But this standard stops at the pattern, not the deep cause. What 5th graders graph is true no matter what: the shadow is long in the morning, shortest near midday, and long again in the afternoon, every single day. That repeat is the win here.
"Stars that disappear for a few months have died or burned out."
The stars are still there. They have not gone anywhere. They are just out of view from where you stand during certain months, then they come back on schedule. That is the whole point of the pattern. Orion is gone in summer and blazing again by winter, year after year, like clockwork.
"Daylight hours are the same all year because a day is always 24 hours."
A full day-and-night is always 24 hours, that part is true. But the DAYLIGHT inside it changes. Some days have more hours of sunlight than dark, and some have less. When 5th graders graph sunrise-to-sunset times across the year, the bars clearly grow and shrink. The 24 hours stay; the split between light and dark does not.
"Seasons happen because Earth gets closer to and farther from the sun."
This standard does not ask 5th graders to explain why seasons happen at all, and the closer-farther idea is actually a common wrong answer. Keep the focus on the pattern: daylight hours and star sightings change on a yearly schedule you can graph. Save the cause of seasons for middle school.
🙋 Common Student Questions and How to Respond
These come up almost every time this standard gets taught. Plan a response and you'll keep the lesson focused.
Don't hand them the why. Point them back to their own data. Ask, "When was the shadow shortest? When was it longest?" Help them see it repeats this exact way every day. For this standard, the pattern IS the answer. The deep cause waits for middle school.
Push them to test it with the calendar. Ask, "Did those same stars show up last winter? Will they show up next winter?" Lead them to see the stars come back on a schedule. They were never gone, just out of view for a season.
Ask them to look at their daylight bar graph first. "Which month has the tallest bar? The shortest?" Let the graph do the talking. They'll see daylight climbs toward summer and drops toward winter, the same way every year. That repeating swing is what the standard wants them to find.
This is the predicting move, and it's the goal. Ask, "If daylight grew every month from January to June this year, what do you bet it does next year?" Have them use the graph to predict a month they didn't measure. A pattern you can predict is a pattern you really understand.
📓 Teaching Resources for 5-ESS1-2
These resources are aligned to this standard.
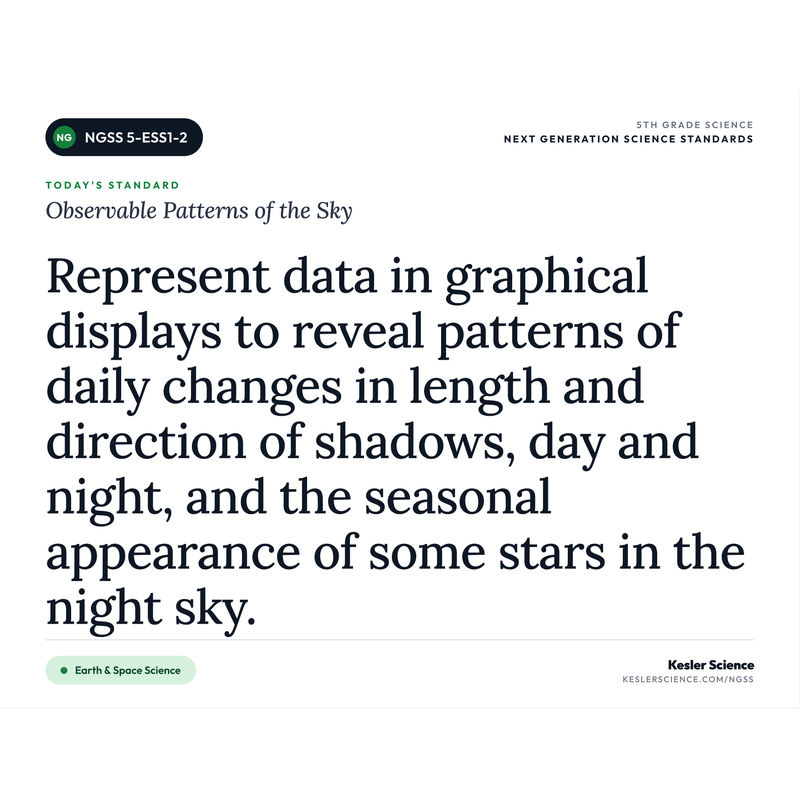
Print-ready classroom poster pack for 5-ESS1-2. Includes the verbatim NGSS performance expectation plus student-language "I Can" statements broken into daily learning goals. Landscape orientation, letter size, ready to print and post on your wall.
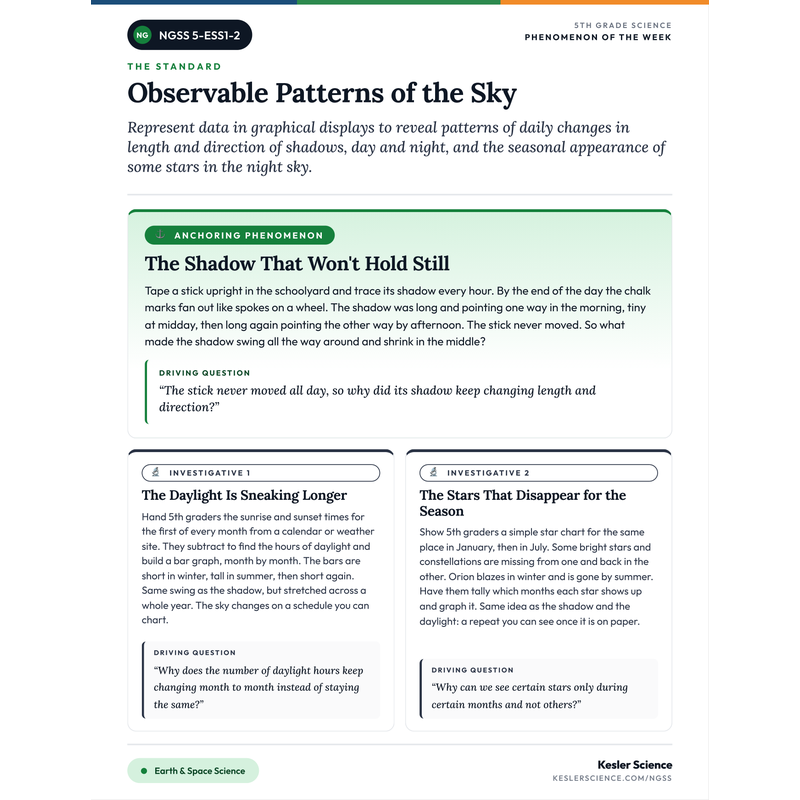
One-page printable with the anchoring phenomenon plus two investigative phenomena for 5-ESS1-2. Each one comes with the driving question students will keep asking. Pin it above your desk for the week — one piece of paper, one week of hooks.
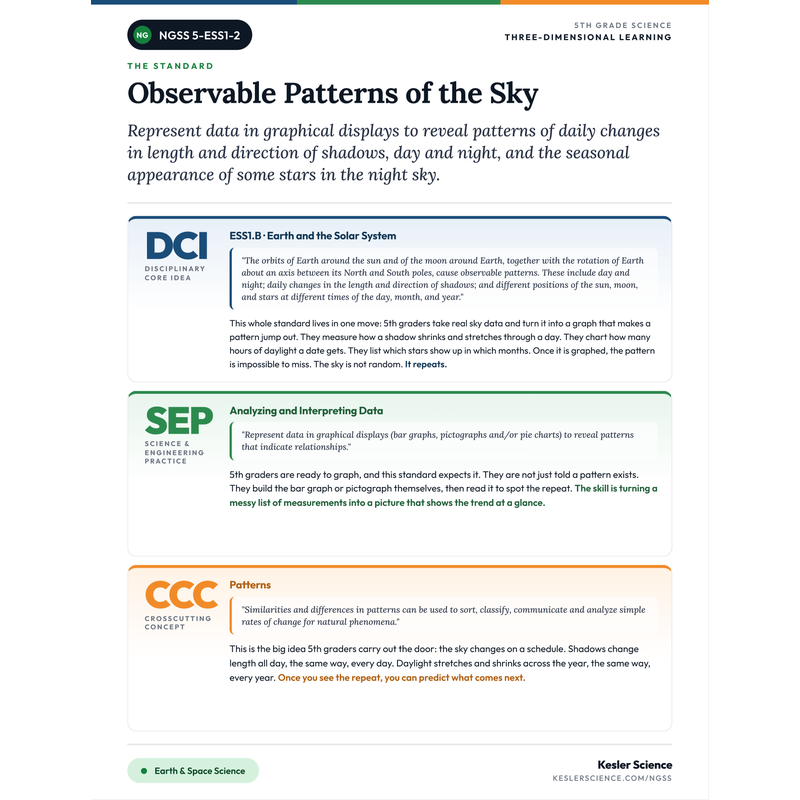
Teacher-facing PDF that breaks down the DCI, SEP, and CCC for 5-ESS1-2 in plain English. Color-coded by dimension so you can read the whole standard at a glance. Perfect for lesson planning or a sub folder.

The full unit for 5-ESS1-2: differentiated station labs, editable presentations, interactive notebooks (English + Spanish), student-choice projects, and assessments. Built on the 5E model.

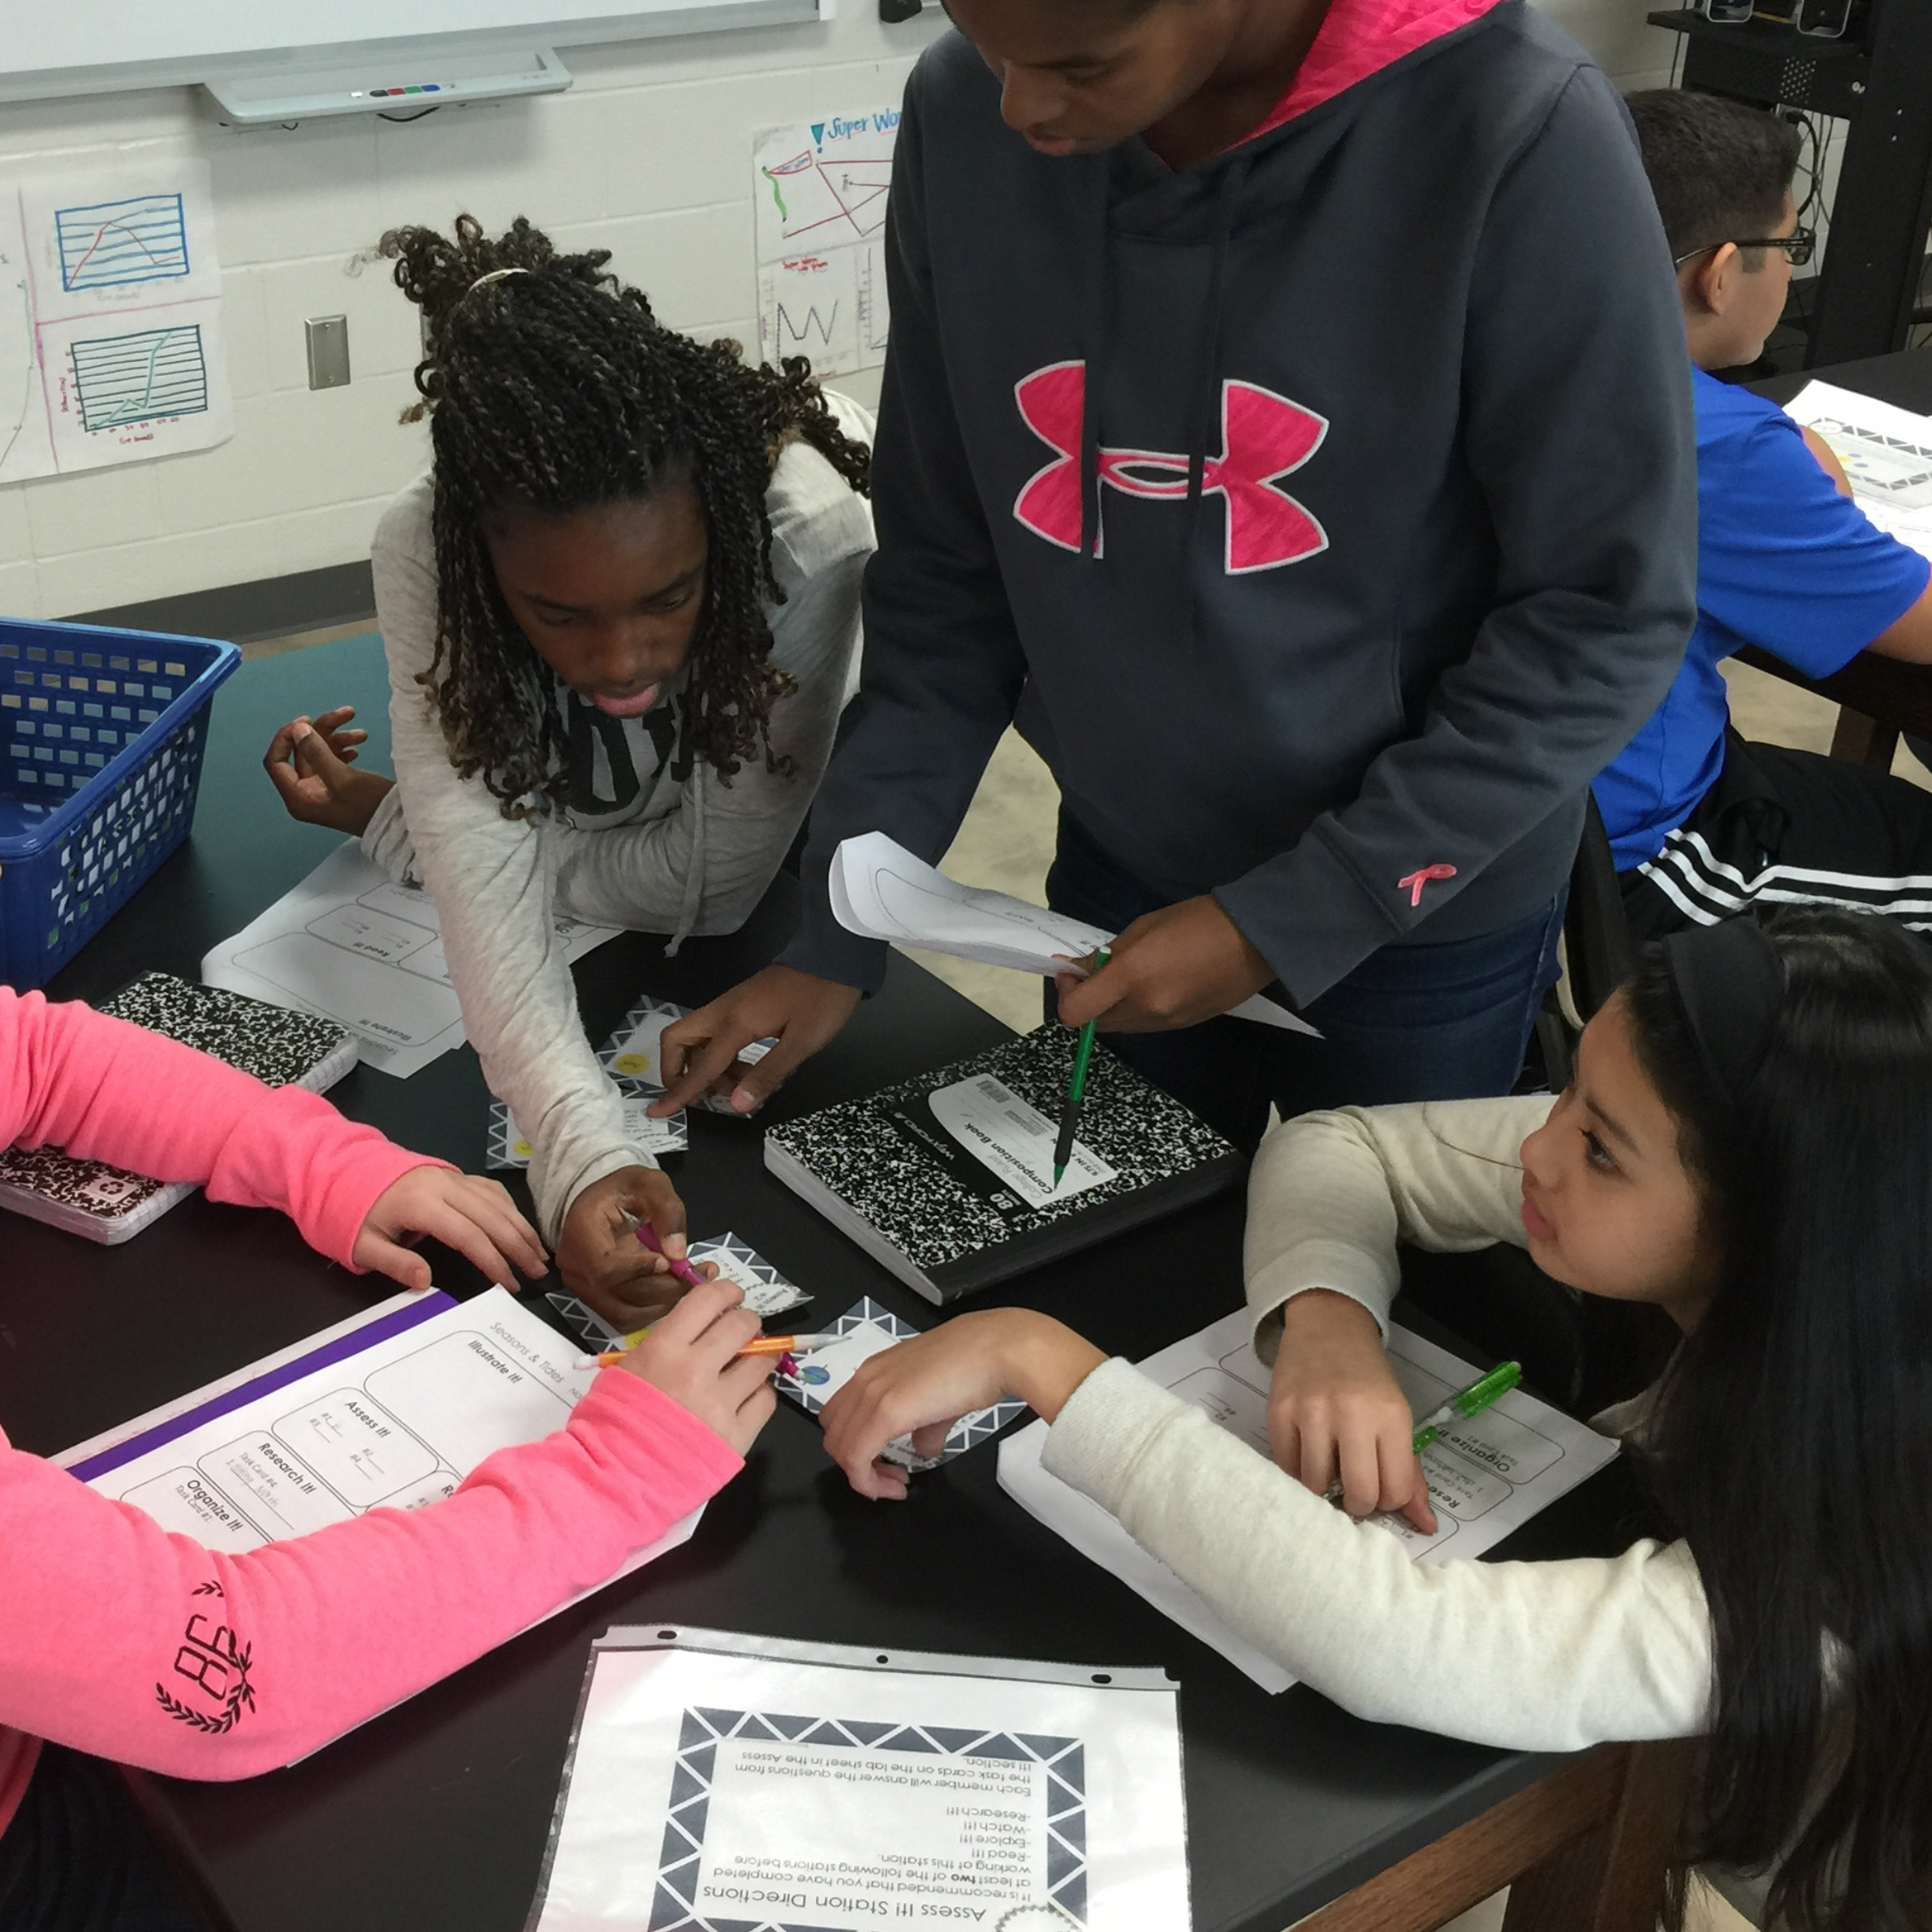
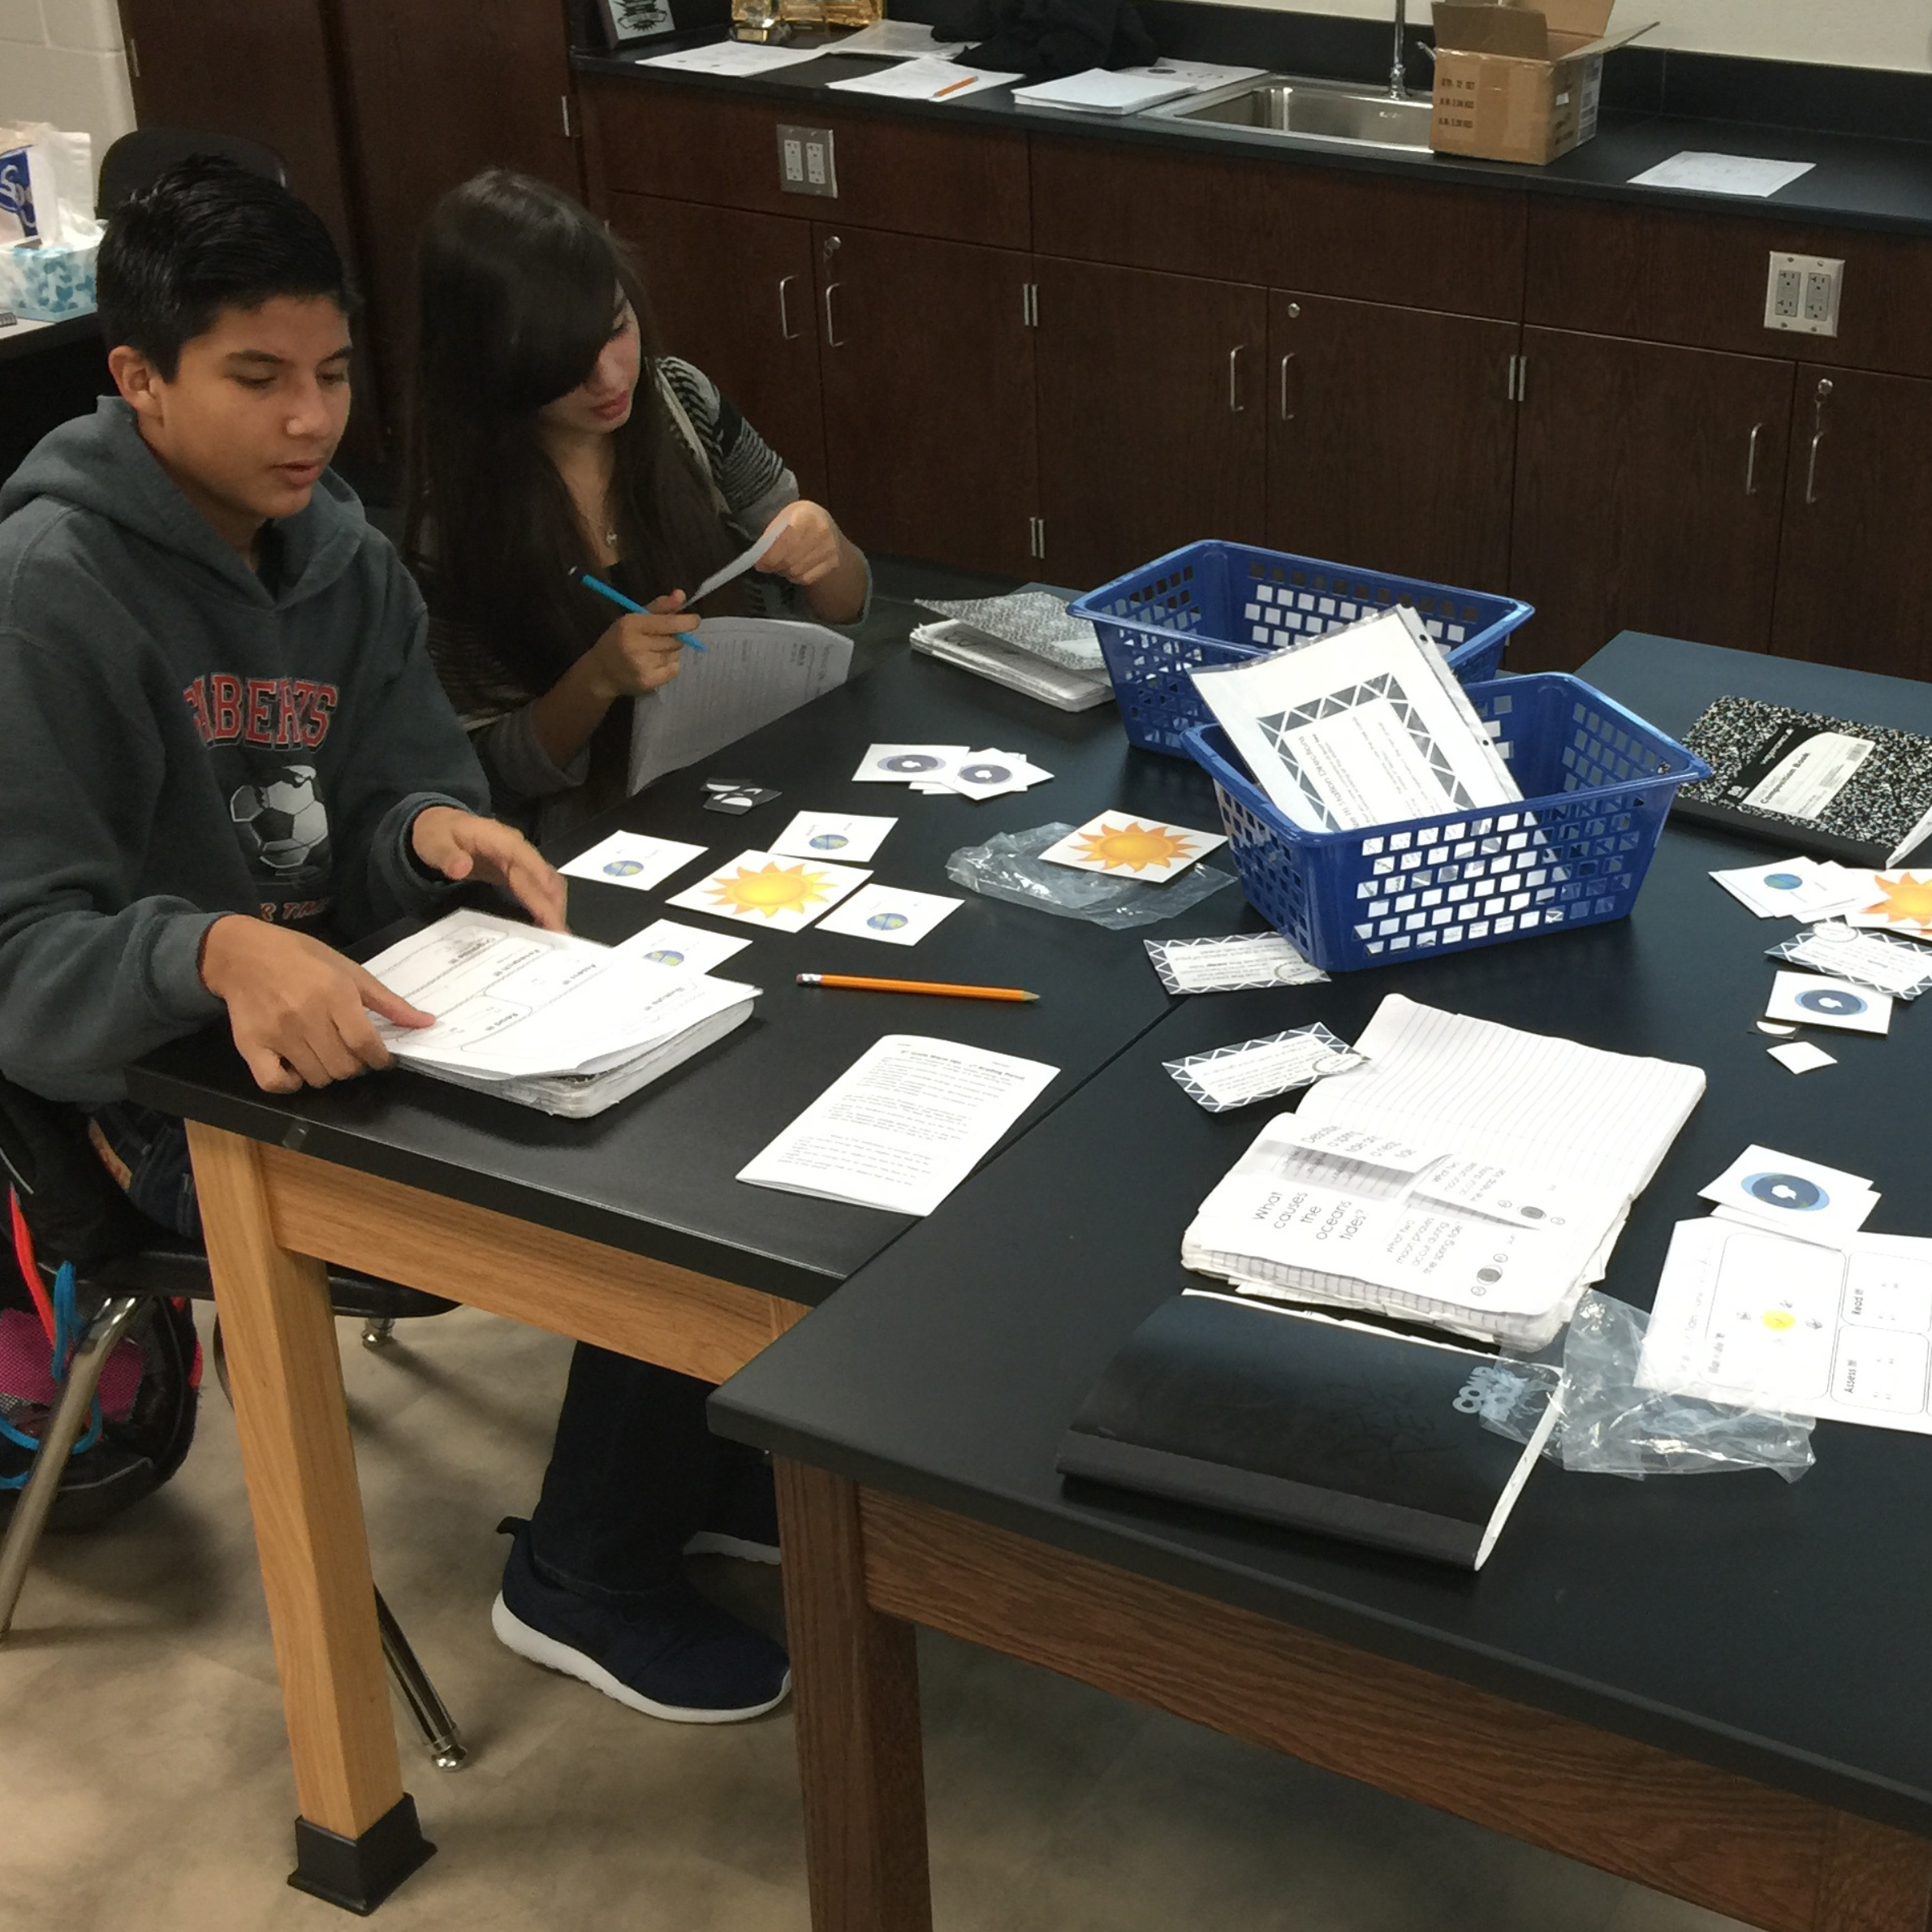
9-station hands-on lab covering the daily and seasonal patterns of the sun, moon, and stars, with input stations (Explore It!, Watch It!, Read It!, Research It!) and output stations (Organize It!, Illustrate It!, Write It!, Assess It!). Print and digital. English and Spanish.

A print-and-digital science writing activity where students reason and write about observable patterns of the sky through an engaging real-world prompt. Includes teacher directions with an answer guide and project ideas. Great for constructed response, bell-ringers, or science journals.
Teaching more than this one standard?
Get every I Can poster, phenomenon hook, and 3-dimension sheet for all 16 5th Grade standards, in one download. The whole year, ready to print.
📚 Vocabulary Students Need for 5-ESS1-2
The terms students need to access this standard. Definitions in plain-English, classroom-ready language.
💡 Free Engagement Ideas for 5-ESS1-2
Schoolyard Shadow Tracking
Tape a meter stick or dowel upright on the blacktop and have groups trace and measure its shadow every hour across the school day. They record each length in a table, then build a bar graph of shadow length by time. The graph shows the shadow shrinking to a low point near midday and stretching back out. This is the anchor turned into a real lab.
Indoor Flashlight Shadow Model
If the weather won't cooperate, move a flashlight slowly in an arc over a standing pencil while 5th graders measure the shadow at each position. They graph how the shadow length changes as the light moves low, high, and low again. It mirrors the schoolyard pattern so they can connect the model to the real thing.
Year of Daylight Bar Graph
Give groups the sunrise and sunset times for the first of each month from a calendar or weather site. They subtract to find daylight hours and build a 12-bar graph across the year. Then they circle the longest and shortest months and write the pattern they see. Turns the standard's graphing skill into the main event.
Seasonal Star Sorting Pictograph
Hand out simple star charts for winter and summer for your location. 5th graders tally which bright stars or constellations appear in which season and build a pictograph using a star symbol for each sighting. They use it to predict which stars they'll spot next month. Ties the come-and-go stars into the same pattern idea.
📝 Assessment Ideas for 5-ESS1-2
Three short tasks that hit all three dimensions. Doable in one class period each.
Give 5th graders a data table of shadow lengths measured every hour. They build a bar graph from it and write one or two sentences describing the pattern the graph reveals, naming when the shadow is shortest and longest. Checks that they can turn data into a graph and read the pattern back out.
Show a finished bar graph of daylight hours for the year but with two months left blank. 5th graders predict the daylight hours for those months using the pattern and explain their reasoning by pointing to the bars around them. No new data needed, just reading and predicting from the graph.
Give 5th graders a pictograph showing which months a star is visible. They write a short explanation of the pattern and predict whether the star will be visible three months later, citing the graph. A picture-based check that they see the seasonal star pattern repeat and can use it to predict.
🎯 What Proficient Student Work Looks Like
Same prompt, three student responses at different proficiency levels. Use as anchor papers when scoring.
"Use the shadow data table to build a bar graph, then describe the pattern your graph reveals about how the shadow changes during the day."
- A specific claim backed by data or observation
- Use of standard-specific vocabulary in context
- Connection between what students observe and the underlying science idea
- A question they're still wondering about (curiosity stays alive)
"I made my graph. The shadow gets little and then big. The bar in the middle is small. The sun makes the shadow move."
Built a graph and noticed the middle bar is short, which is a start. But the pattern is vague ("little and then big") with no times or measurements, and it reaches for the cause ("the sun makes it move") instead of describing the repeat the standard asks for.
"My bar graph shows the shadow was 60 cm at 9 a.m., then dropped to 10 cm at noon, then grew back to 55 cm at 3 p.m. The pattern is the shadow is longest in the morning and afternoon and shortest in the middle of the day. You can see it in the graph because the bars dip down low in the middle and are tall on both ends."
Builds the graph, cites real measurements, and names the pattern the graph reveals: short in the middle, long on the ends. Reads the pattern straight off the bars. This is exactly what the standard asks a 5th grader to do.
"My graph shows the shadow shrinking from 60 cm at 9 a.m. to 10 cm at noon, then stretching back to 55 cm by 3 p.m., so the bars dip low in the middle then climb back up. The pattern is the shadow is always shortest near the middle of the day. Since this repeats the same way every day, I predict tomorrow the shadow will be shortest around noon again."
Cites specific measurements, names the dip-and-climb pattern in the bars, AND uses the repeat to predict tomorrow's shadow. Ties the data, the graph, and the predicting power of patterns together. Reaches the crosscutting concept without being asked.
“Next Generation Science Standards” is a registered trademark of WestEd. Neither WestEd nor the lead states and partners that developed the Next Generation Science Standards were involved in the production of, and do not endorse, this product.
NGSS performance expectations © 2013 Achieve, Inc. The Disciplinary Core Idea, Science and Engineering Practice, and Crosscutting Concept descriptions are reproduced from A Framework for K-12 Science Education with permission from the National Academies Press.
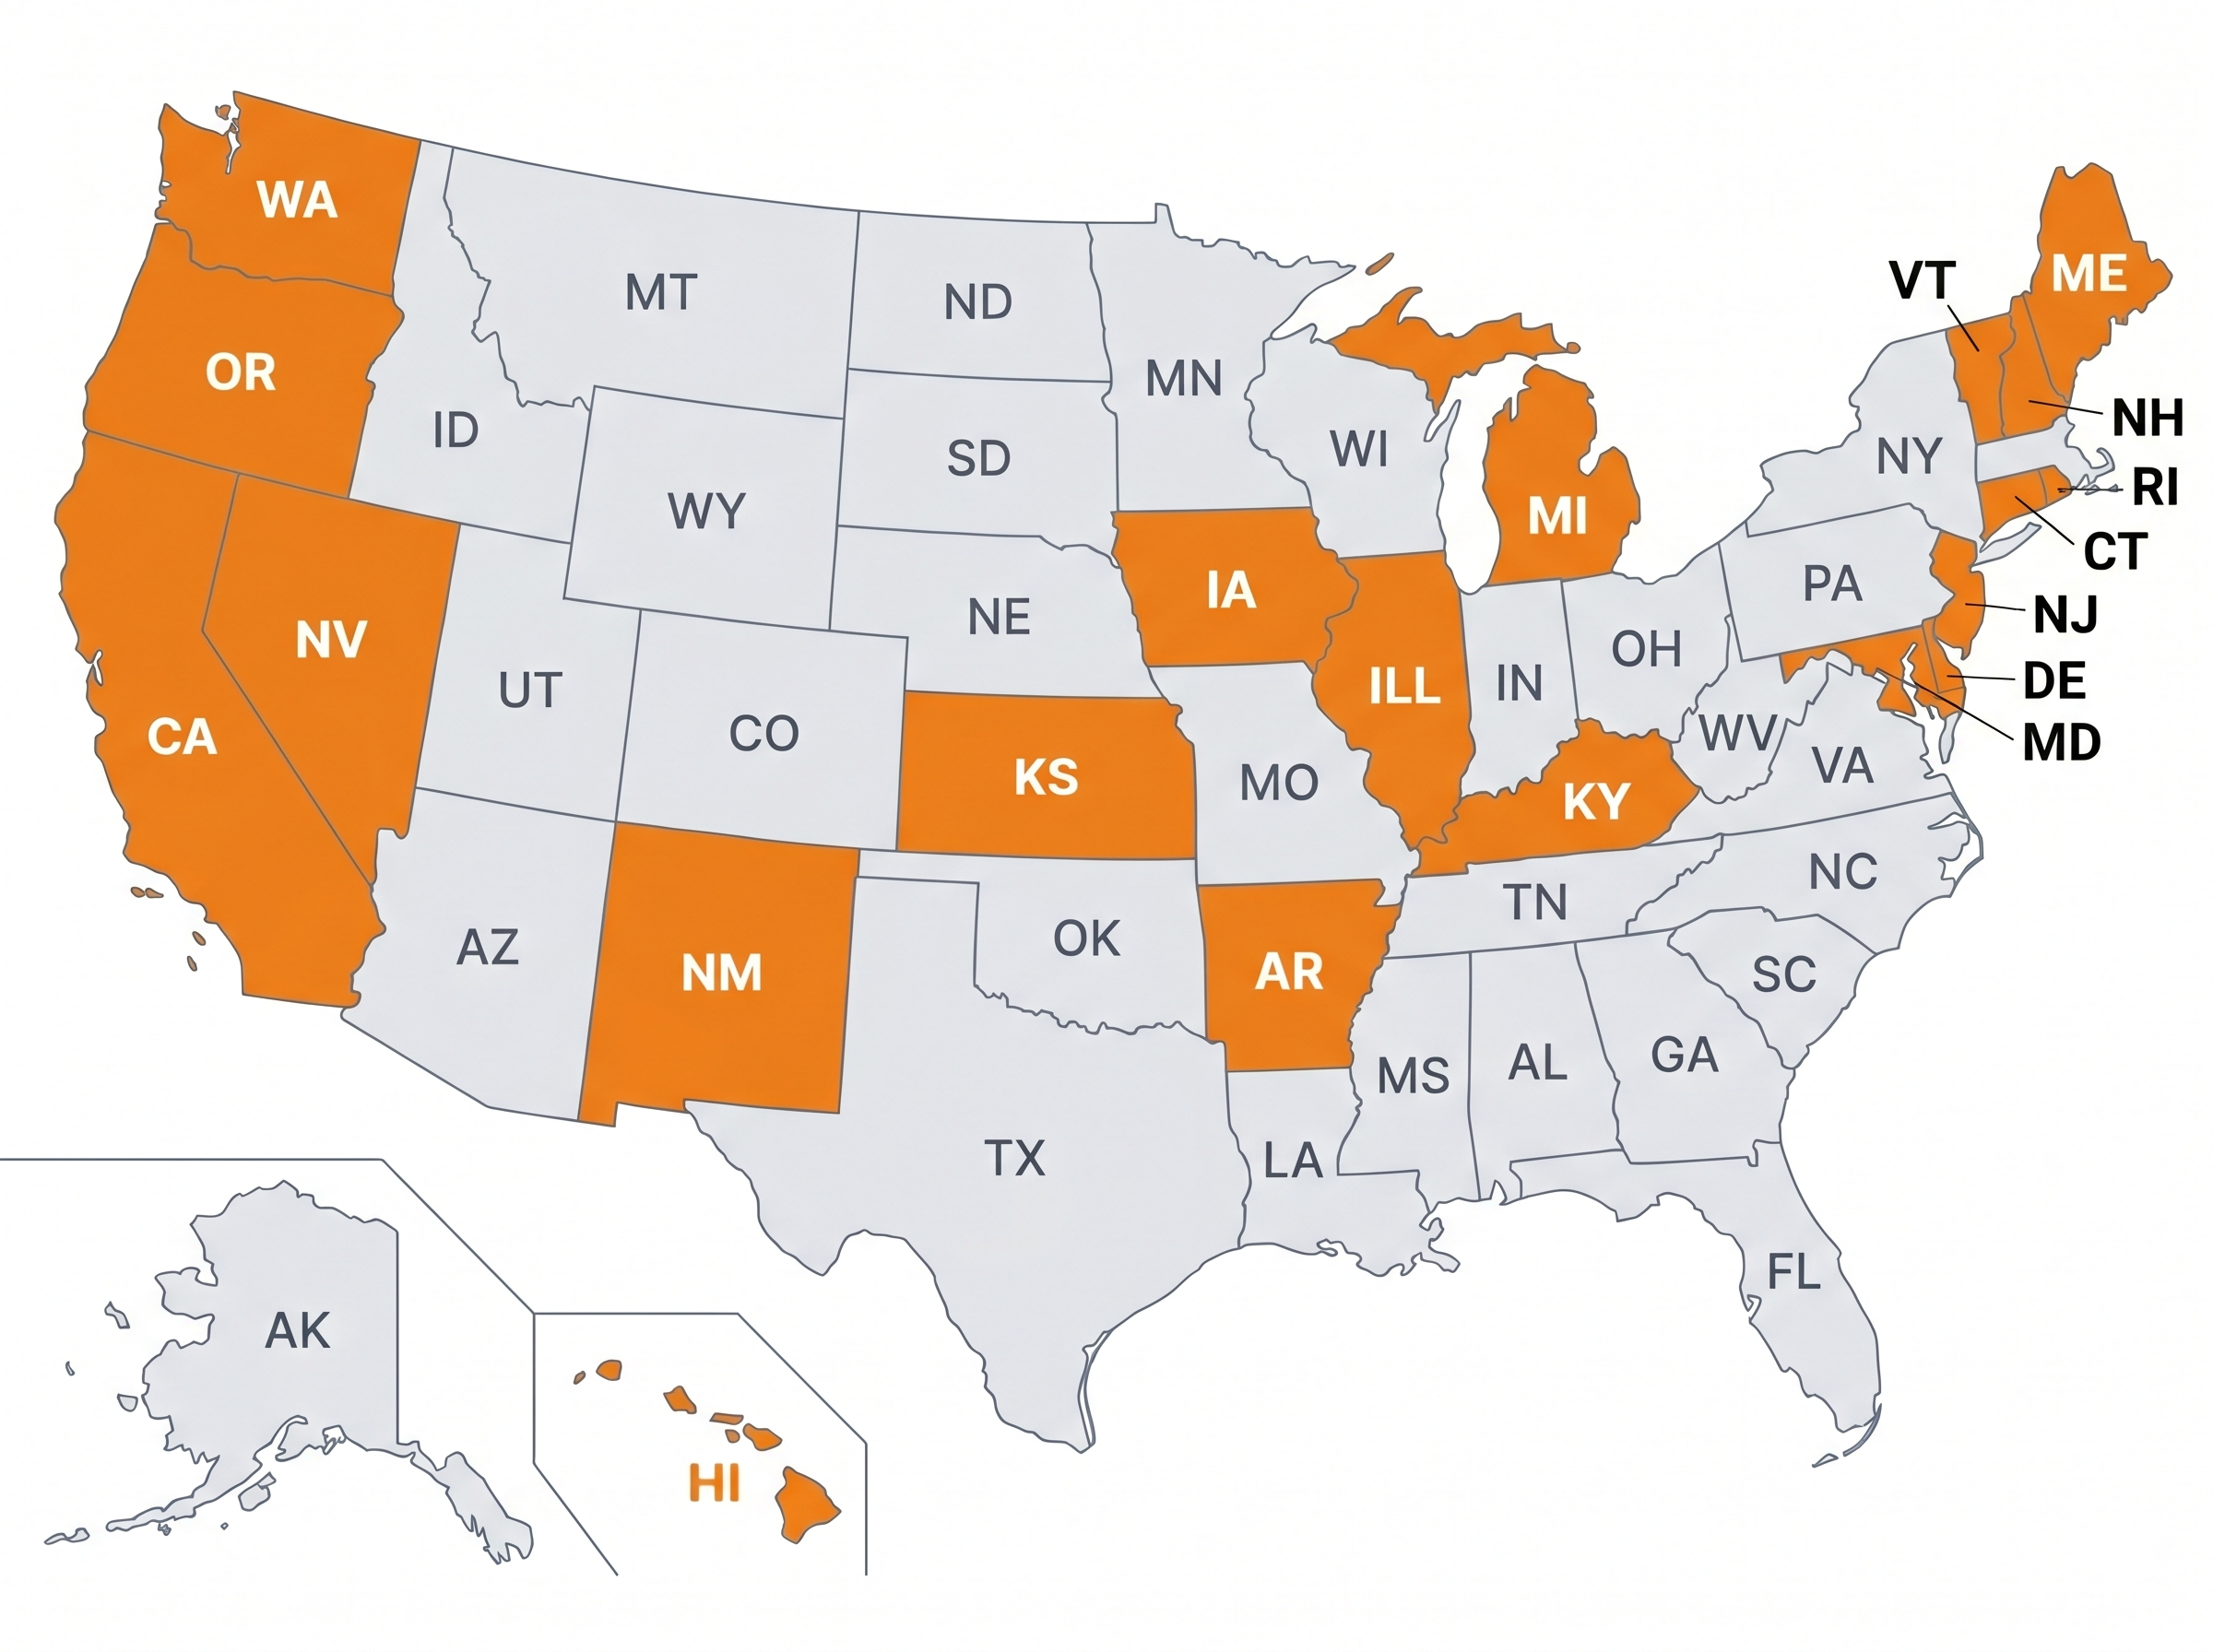
Trusted Across NGSS States
From California to Connecticut, science teachers in the 20 states that adopted NGSS are using Kesler Science to save time and engage students.
Teachers in NGSS States
Love Kesler Science
What Teachers Are Saying
"I'm able to access rigorous NGSS-aligned lessons and labs that are ready to use, so I spend more time helping students directly and less time searching for quality material."
"There's a lesson for each of the NGSS, so I don't have to search for hours to find a good quality lesson. I can spend more time actually teaching."
"The resources help me cover NGSS in a meaningful way, and my students gain a deeper knowledge of the concepts, with learning that's more self-driven."
Give Your Science Teachers Everything They Need
School and district licenses give your teachers access to every resource they need, including station labs, inquiry labs, anchoring phenomena, presentations, escape rooms, and much more. One purchase covers the grade levels you need.
- PO-friendly. We accept purchase orders
- Volume discounts for 11+ teachers
- Complimentary membership orientation for 4+ teachers
- Three free implementation PD sessions for departments of 11+
- Aligned to the NGSS standards
See It in Action
Book a walkthrough and we'll show you how Kesler Science fits your campus.
Book Demo CallNo pressure, no hard sell
"My assistant principal stopped in my room and immediately noticed how the students were engrossed in their centers and how they moved seamlessly from center to center. Also the built-in modifications really impressed!"
"It provides differentiated instruction for all types of learners, allowing them to become more engaged."
"I love it all!! I have become a facilitator in my class and I love the excitement it brings to my class. The kids love all that we do with the Kesler products."