.png?width=375&height=100&name=WebPage%20logo%20with%20curves%202026%20(8).png)
NGSS Resource Hub
Three-dimensional breakdowns, phenomena, and classroom-ready activities for every NGSS standard, grades 4-8.

🚀 Jump to Your Discipline
5th Grade NGSS Standards
Pick any standard. Each page is your full lesson-planning workspace for that standard.
Distribution of Water on Earth: Most of It Is Salty, and the Fresh Water Is Locked Away
"Describe and graph the amounts of salt water and fresh water in various reservoirs to provide evidence about the distribution of water on Earth."
NGSS Lead States. (2013). Next Generation Science Standards: For states, by states (5-ESS2-2). The National Academies Press. https://www.nextgenscience.org/dci-arrangement/5-ess2-earths-systems
Students focus only on oceans, lakes, rivers, glaciers, groundwater, and polar ice caps, and they are not expected to include the atmosphere.
Summarized in our own words from the 5-ESS2-2 assessment boundary (NGSS Lead States, 2013). Not a verbatim quote.
The three dimensions packed into this standard
Every standard bundles a DCI (the content), a SEP (the science practice), and a CCC (the crosscutting lens). They run in the same task, not in sequence.
"Nearly all of Earth's available water is in the ocean. Most fresh water is in glaciers or underground; only a tiny fraction is in streams, lakes, wetlands, and the atmosphere."
National Research Council. (2012). A framework for K-12 science education: Practices, crosscutting concepts, and core ideas. The National Academies Press. https://doi.org/10.17226/13165
Picture all the water on Earth as 100 cups. About 97 of those cups are salty ocean water. Only 3 are fresh. And most of those 3 are frozen in glaciers or hidden underground. That leaves barely a splash in the lakes and rivers we can actually use. 5th graders take that fact and turn it into a graph that shows the sizes side by side.
"Describe and graph quantities such as area and volume to address scientific questions."
National Research Council. (2012). A framework for K-12 science education. The National Academies Press.
Instead of being told "most water is salty," 5th graders take real amounts and build a graph that proves it. The skill is turning numbers into a picture, then reading that picture to answer a question about where Earth's water actually is.
"Standard units are used to measure and describe physical quantities such as weight and volume."
National Research Council. (2012). A framework for K-12 science education. The National Academies Press.
Amounts only make sense when you compare them. One liter of ocean water doesn't mean much until you line it up next to a spoonful of river water. The graph shows the proportion. A tiny bar next to a giant bar tells the whole story.
📍 Where This Standard Fits in the K-12 Progression
Use this to plan the year. Knowing what students should already know and what they're heading toward keeps the lesson focused.
Back in 2nd grade, students learned that water on Earth shows up as both solid and liquid, and they pointed out where water is found: oceans, rivers, lakes, ponds. They could name where water lives. They had not yet measured the amounts or seen how lopsided the salt-water and fresh-water shares really are.
Distribution of Water on Earth: Most of It Is Salty, and the Fresh Water Is Locked Away
In middle school, students model how water cycles through Earth's systems, driven by sunlight and gravity. They move from "where the water is" to "how the water keeps moving" between the ocean, the atmosphere, the ground, and living things.
🌎 Phenomena for 5-ESS2-2
Anchor the lesson in one puzzling phenomenon kids keep coming back to. Use the two investigative phenomena to sharpen specific facets.
100 Cups of Earth's Water
Fill 100 small clear cups with water to stand for all the water on Earth. Then a guide sorts them. Ninety-seven cups get a pinch of salt and slide to the "ocean" side. Only 3 cups stay fresh, and 2 of those get a tiny ice cube for "glaciers," leaving almost nothing for the lakes and rivers we drink from. 5th graders stare at that lonely splash and start asking how the planet can be called a water world.
"If Earth is covered in water, why is almost none of it water we can actually drink?"
- "Why is so much of the water salty instead of fresh?"
- "If the fresh water is frozen in glaciers, can we even use it?"
- "Where does our drinking water come from if the rivers are such a tiny part?"
Salt Water You Can't Drink
Before you run this, check your school's policy on tasting activities in class. Some districts ban any in-class tasting regardless of substance, in which case skip the taste step and just compare the cups visually.
First, each group stirs salt into a cup of plain water until no more will dissolve, which shows the salt really is in there even when you can't see it. Do not taste that over-salted cup. For the taste comparison, use a separate cup with just a small pinch of salt (about a teaspoon per cup) so it tastes more like real seawater. Groups take a tiny taste of fresh water versus that lightly salted cup. The point: the ocean is 97 out of 100 cups, but the salt makes it useless for drinking, so the "tiny splash" of fresh water suddenly matters a lot more.
"The ocean is enormous, so why can't we just drink from it?"
- "What makes ocean water salty in the first place?"
- "Could we take the salt back out to make it drinkable?"
- "If the ocean is most of Earth's water, why isn't it on the drinking-water graph?"
The Frozen Fresh Water
Groups measure how much liquid water a handful of ice cubes makes when it melts, recording the amount before and after. The cubes stand for glaciers and polar ice caps, where most of Earth's fresh water is locked up. This sharpens the anchor by showing that even the small fresh-water share is mostly frozen solid, so the part we can actually reach is tinier still.
"If most fresh water is frozen, how much is left for us to use right now?"
- "How much of the fresh-water cup is really frozen?"
- "Are the glaciers far away from where people live?"
- "If the ice melted, would all of it become water we could drink?"
100% Aligned Lessons for Every NGSS Standard You Teach
The membership gives you access to thousands of lessons and activities designed to boost student engagement and reclaim valuable teaching time. Trusted by schools and districts from every NGSS state.
⚠️ Misconceptions Your Students Will Walk In With
These come up almost every year. Knowing them in advance lets you head them off in the first lesson.
"Most of Earth's water is fresh water we can drink."
It's the opposite. About 97 out of every 100 parts of Earth's water is salty ocean water. Only about 3 parts are fresh. When 5th graders graph the amounts, the salt-water bar towers over everything else, and the drinkable share is almost too small to see.
"All the fresh water on Earth is in lakes and rivers."
Most fresh water is not in lakes and rivers at all. The biggest share is frozen in glaciers and polar ice caps, and a lot more is underground as groundwater. Streams and lakes hold only a tiny fraction. That's why the rivers bar on the graph is so short.
"The ocean is fine to drink because it's just water."
Ocean water has so much salt dissolved in it that drinking it actually makes you thirstier and can make you sick. The salt is the whole problem. That's why having mostly salt water on Earth means we have far less usable water than the planet's blue color makes it look.
"You don't need real amounts to talk about Earth's water, you can just say "a lot" and "a little.""
This standard asks 5th graders to use measured amounts and graph them. "A lot" and "a little" don't show how lopsided it is. A graph with real amounts shows the ocean part is enormous and the river part is tiny, and that picture IS the evidence.
🙋 Common Student Questions and How to Respond
These come up almost every time this standard gets taught. Plan a response and you'll keep the lesson focused.
Push them toward the idea that rivers slowly carry tiny bits of salt from rocks and soil into the ocean over a very long time. The ocean collects it and the salt stays behind. For this standard, the key takeaway is just that the ocean is salty, which is why almost all of Earth's water isn't drinkable.
Don't shut it down, dig in. Ask, "Where are most glaciers, and how easy would it be to get that water to a city?" Steer them to the fact that glacier melt really is fresh water, but it's locked up far away, so it stays out of reach. Add that melting glaciers on purpose isn't a real plan, because uncontrolled melting raises sea levels and causes problems. That's exactly why the usable share on the graph stays so small.
Ask them where rain goes after it soaks into the ground. Groundwater fills the spaces between soil and rock underground, like water in a wet sponge. It's a big part of the fresh-water share, even though it's hidden, so it belongs on their graph.
Great thinking. Tell them scientists don't measure every drop. They estimate the amounts in each reservoir. In class, we use a model like 100 cups to stand in for all of Earth's water. The model lets 5th graders graph the proportions without measuring the whole planet.
📓 Teaching Resources for 5-ESS2-2
These resources are aligned to this standard.
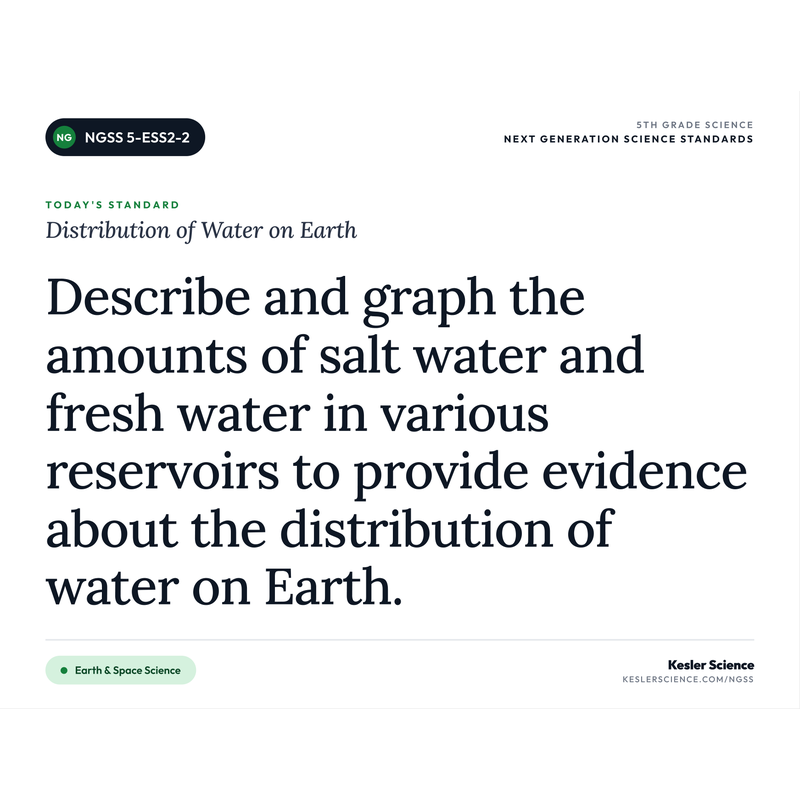
Print-ready classroom poster pack for 5-ESS2-2. Includes the verbatim NGSS performance expectation plus student-language "I Can" statements broken into daily learning goals. Landscape orientation, letter size, ready to print and post on your wall.
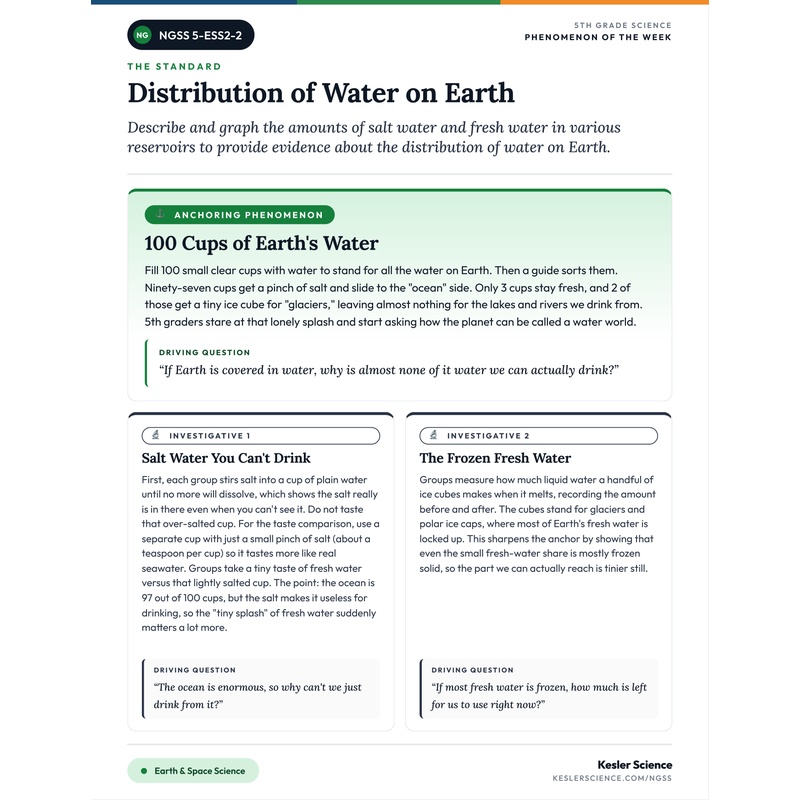
One-page printable with the anchoring phenomenon plus two investigative phenomena for 5-ESS2-2. Each one comes with the driving question students will keep asking. Pin it above your desk for the week — one piece of paper, one week of hooks.
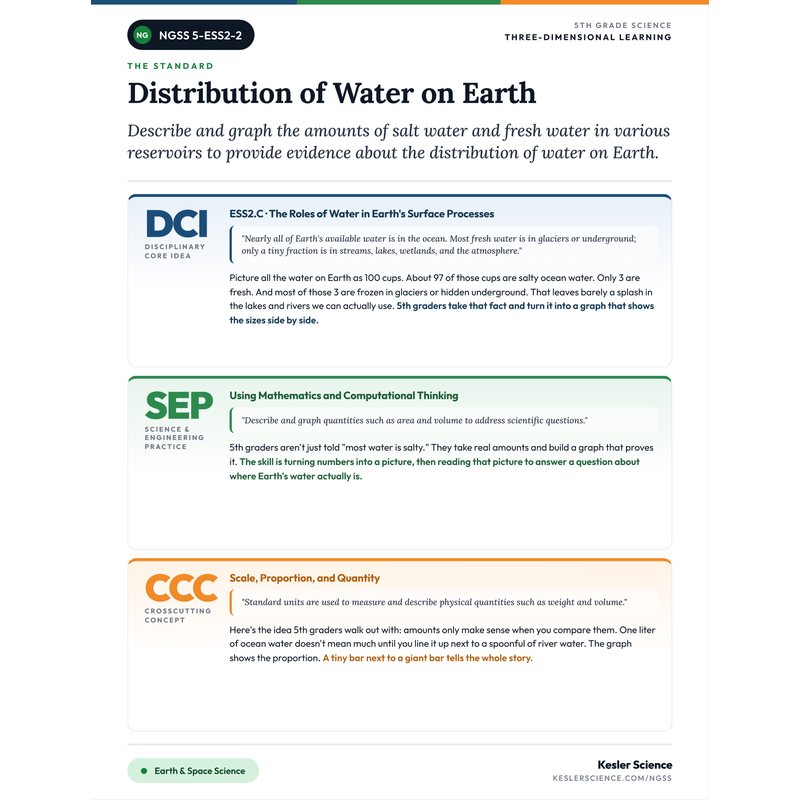
Teacher-facing PDF that breaks down the DCI, SEP, and CCC for 5-ESS2-2 in plain English. Color-coded by dimension so you can read the whole standard at a glance. Perfect for lesson planning or a sub folder.

The full unit for 5-ESS2-2: differentiated station labs, editable presentations, interactive notebooks (English + Spanish), student-choice projects, and assessments. Built on the 5E model.

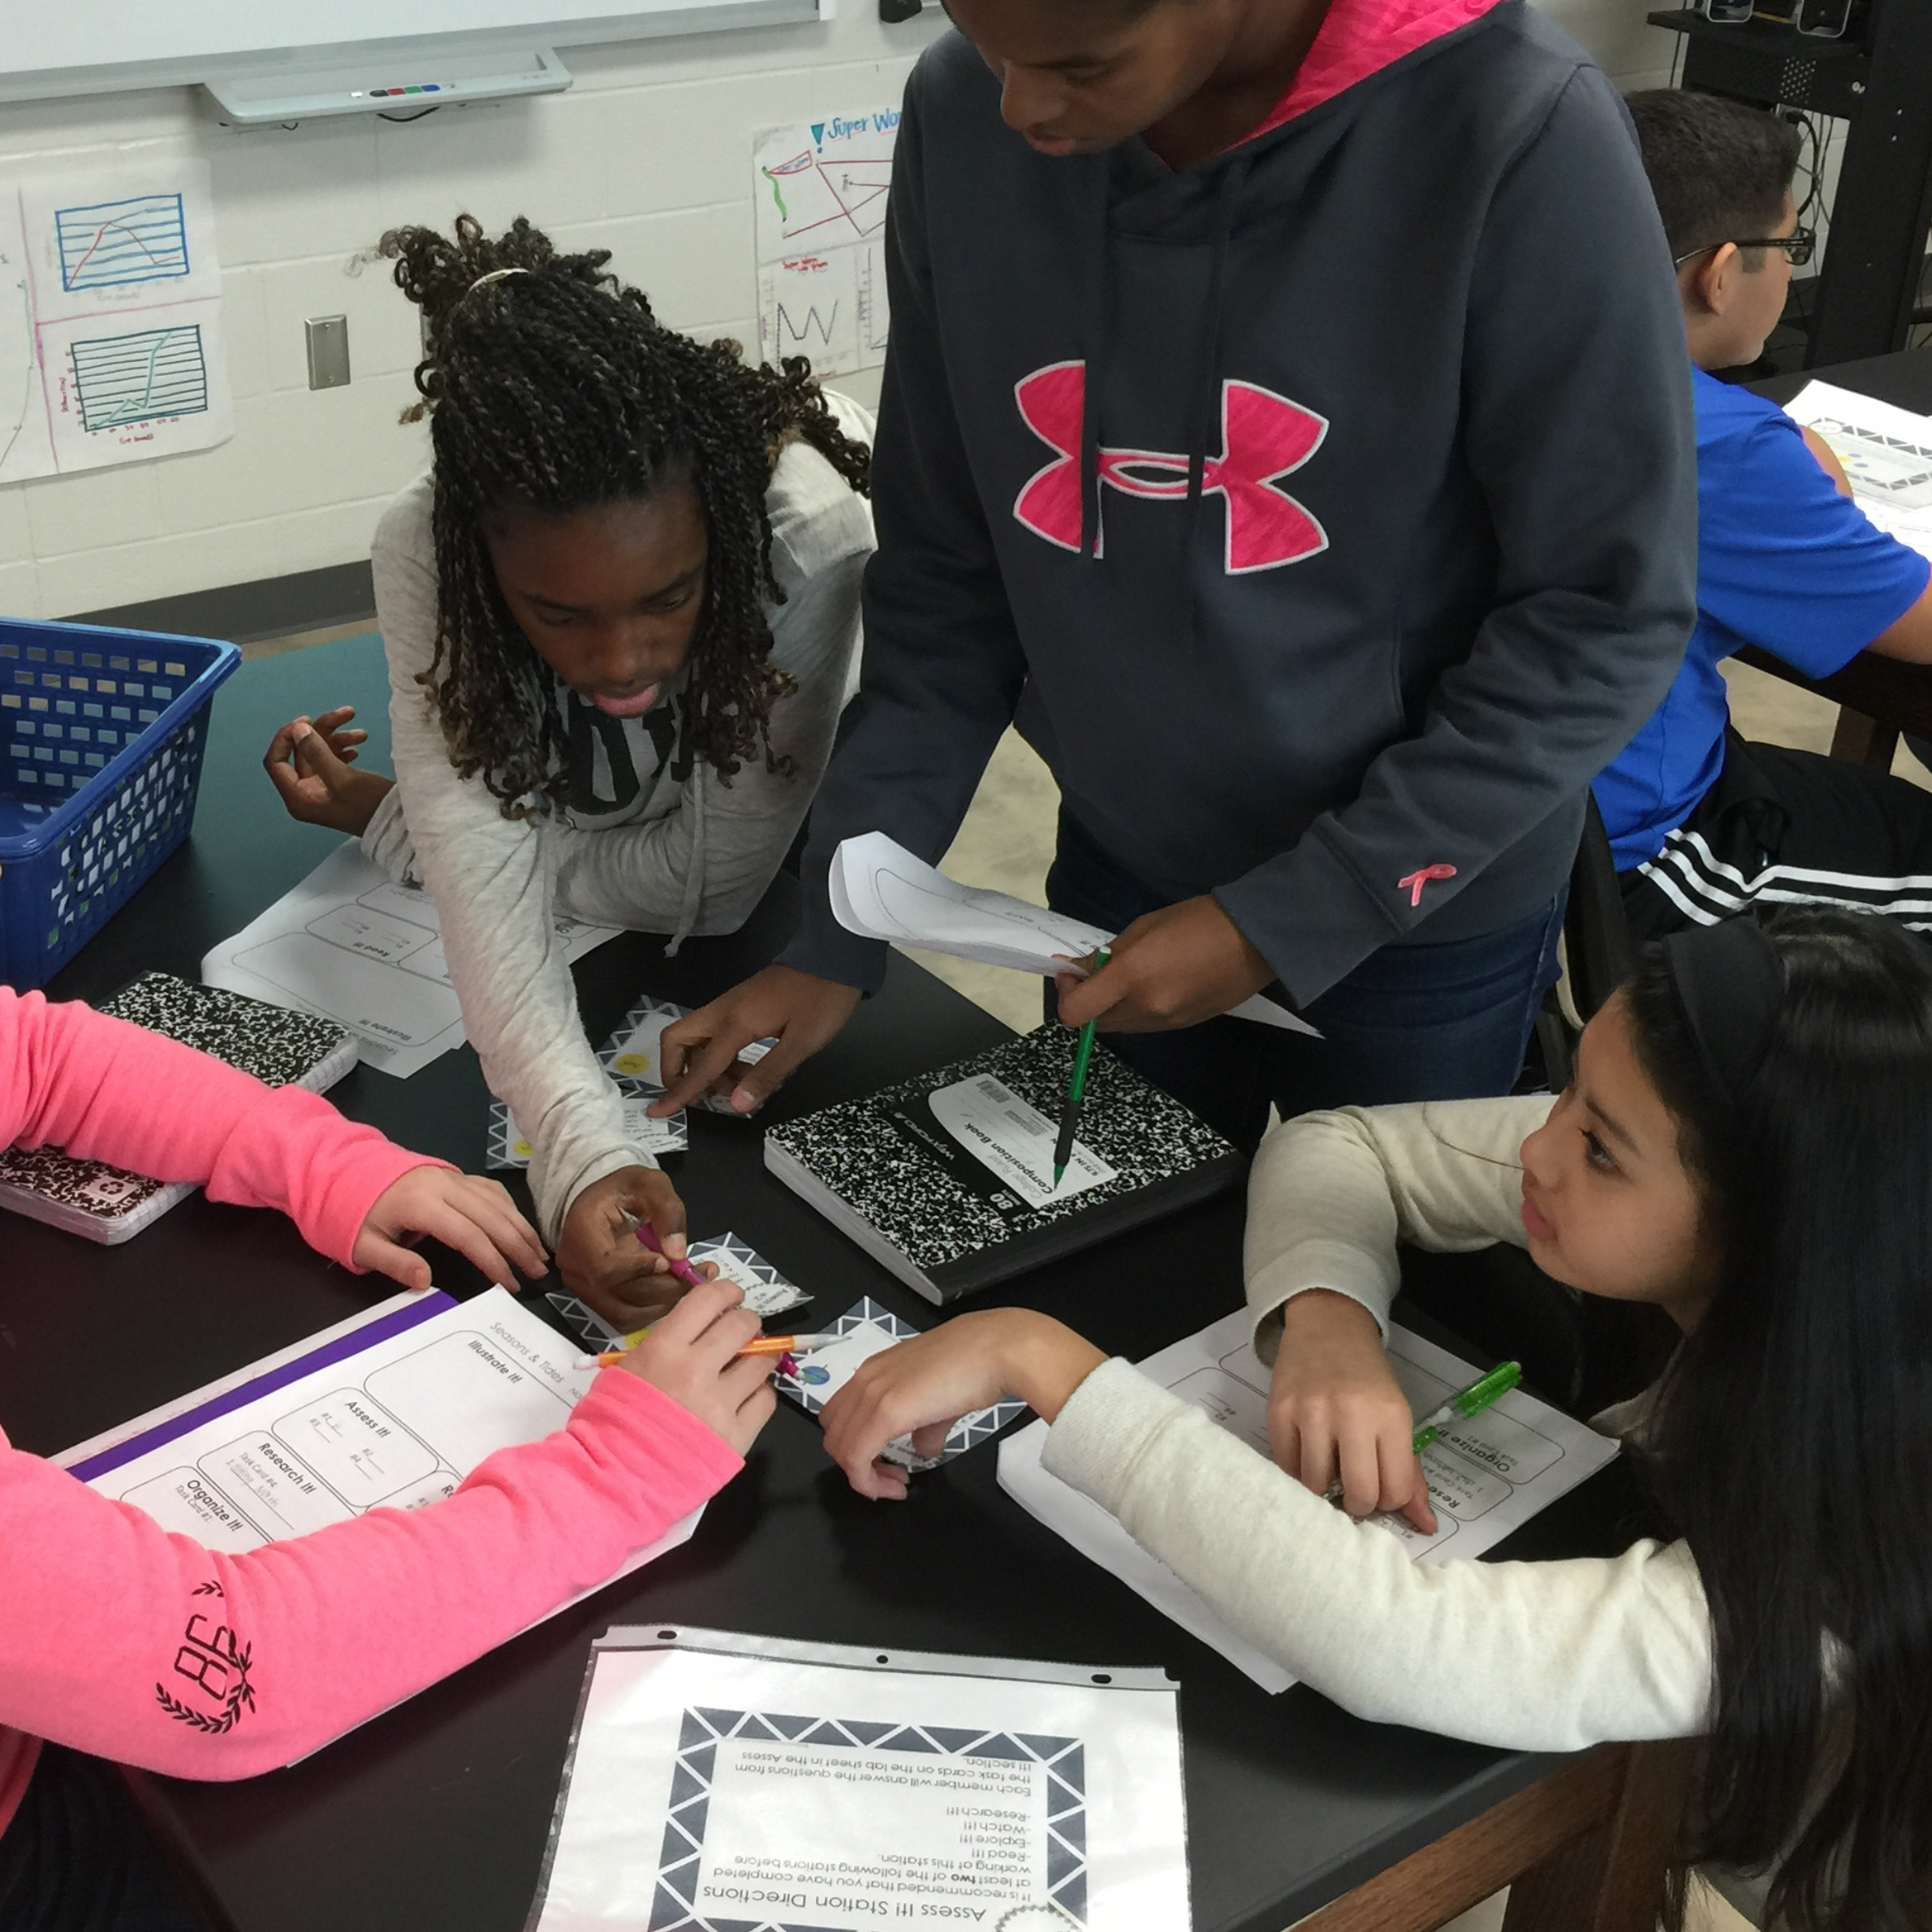
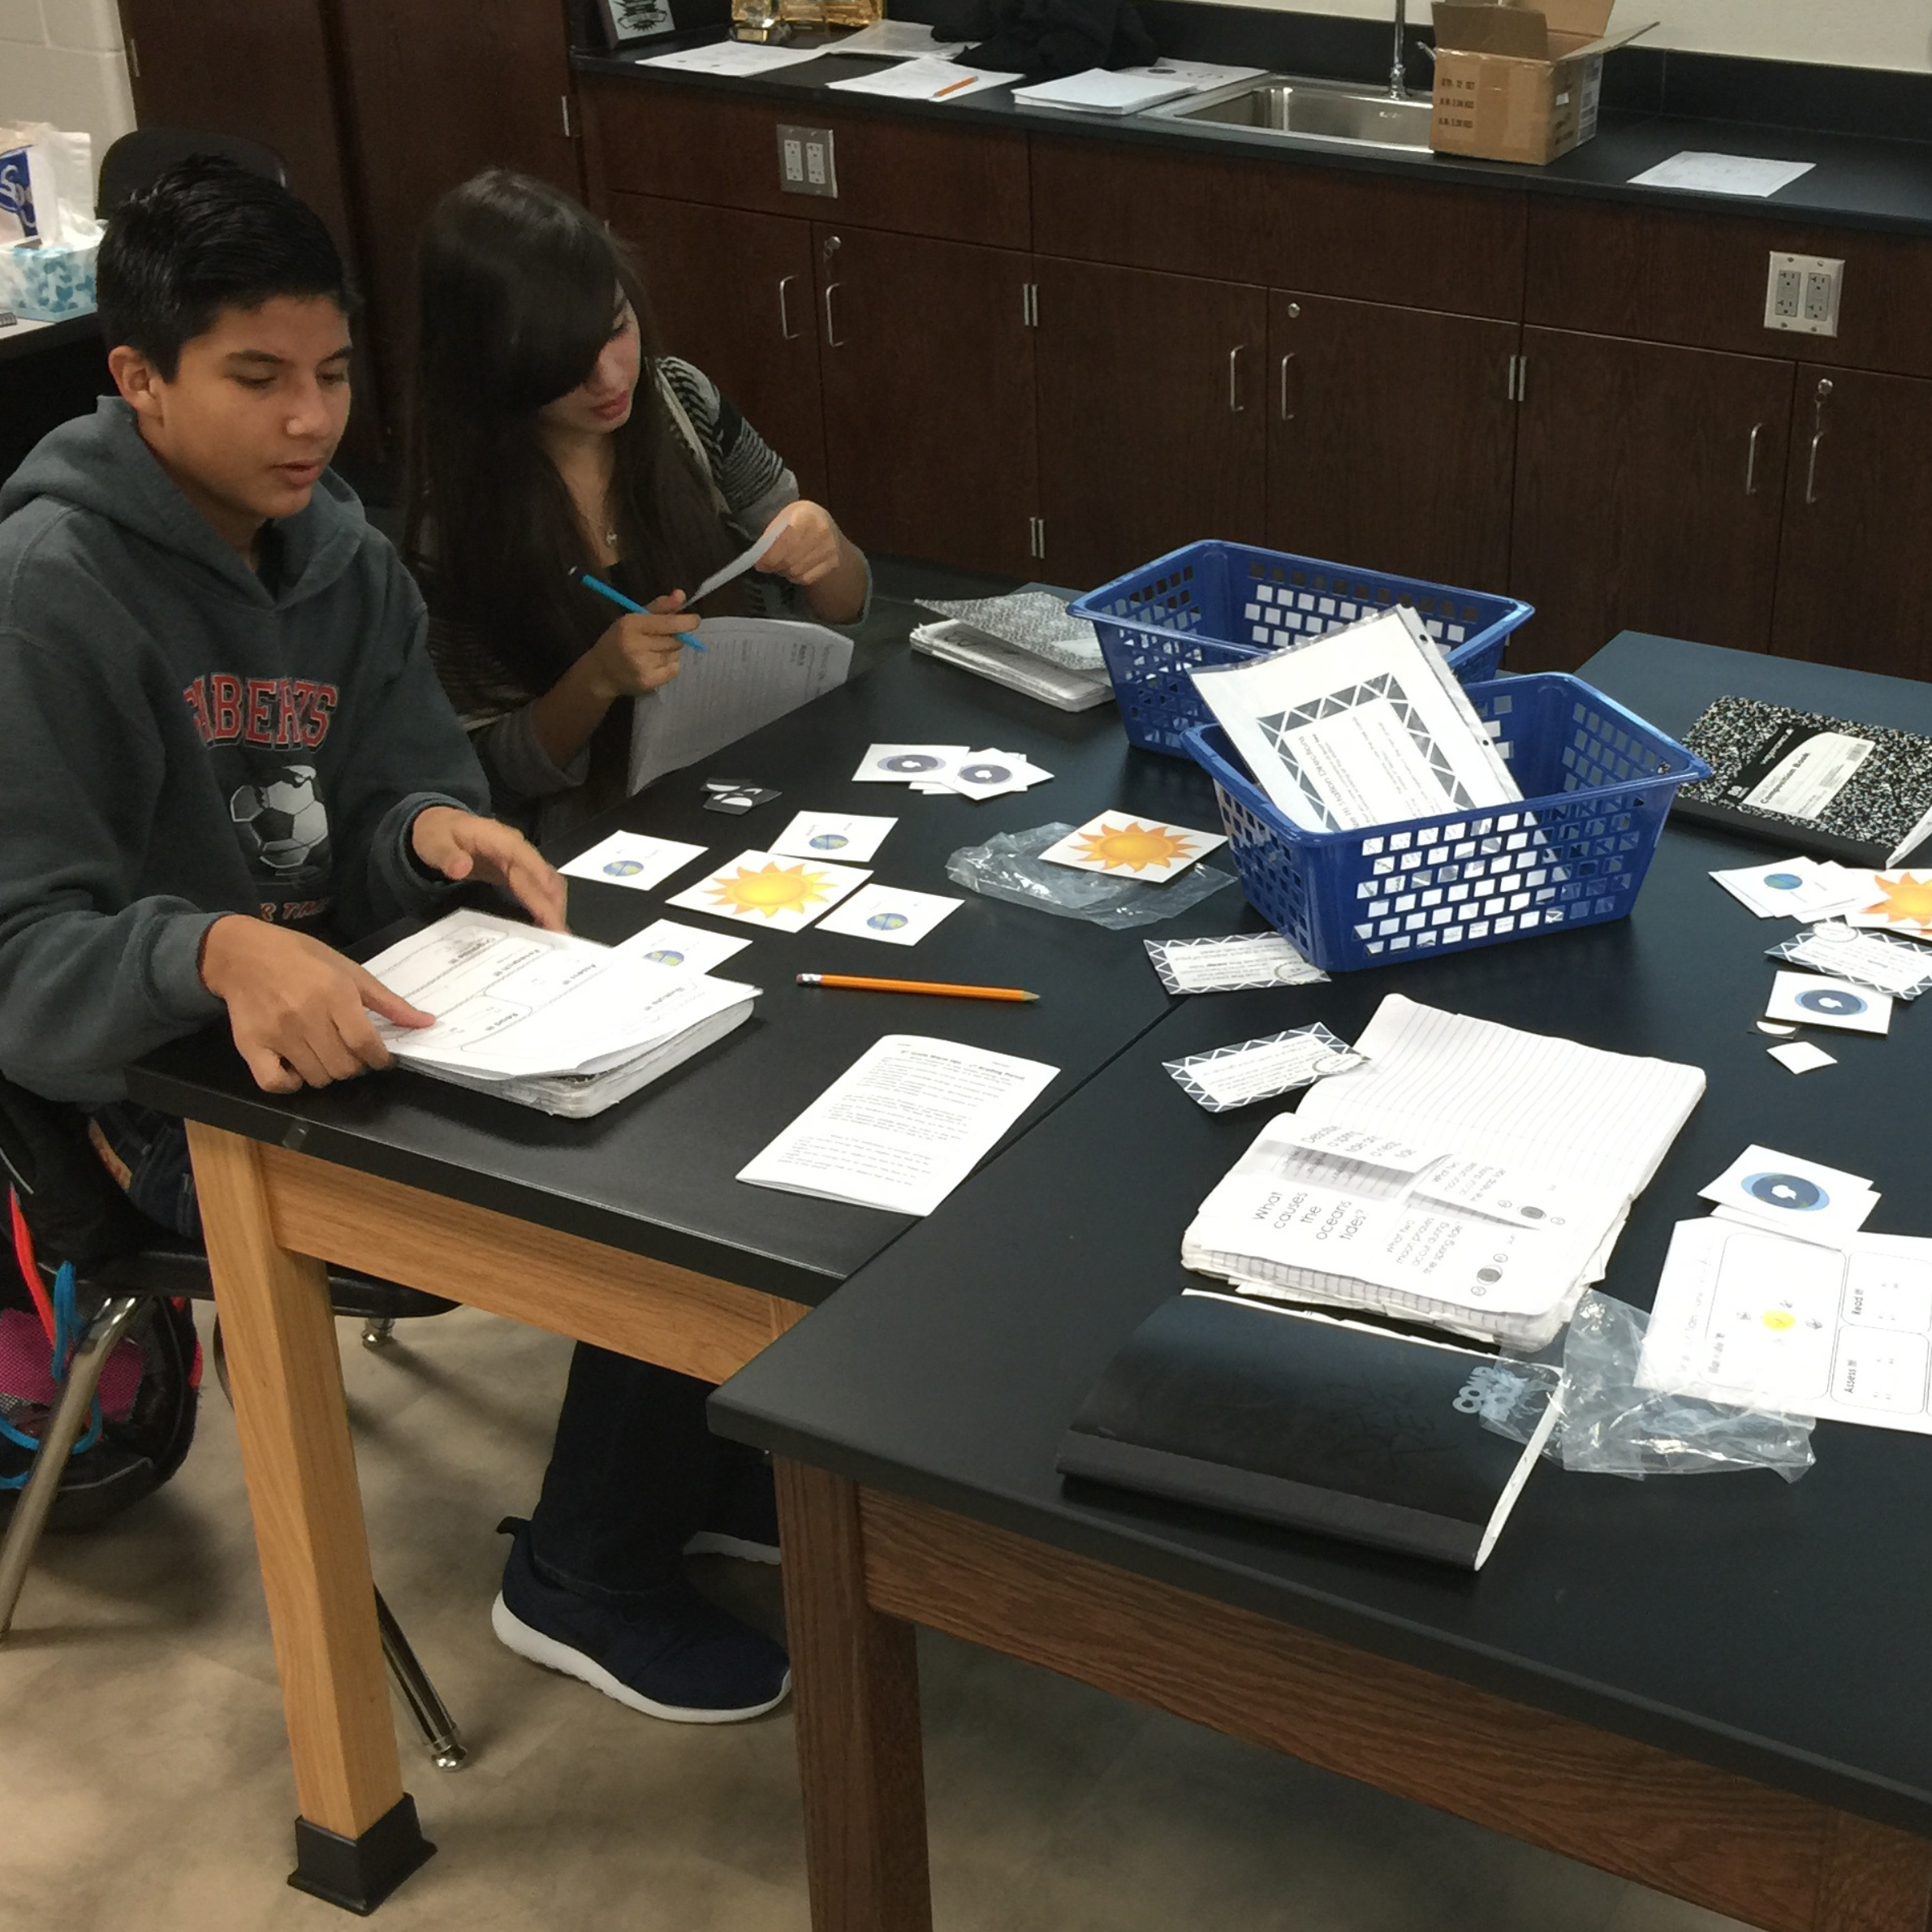
9-station hands-on lab covering where Earth's water is stored and how much is fresh versus salt water, with input stations (Explore It!, Watch It!, Read It!, Research It!) and output stations (Organize It!, Illustrate It!, Write It!, Assess It!). Print and digital. English and Spanish.

A print-and-digital science writing activity where students reason and write about distribution of water on Earth through an engaging real-world prompt. Includes teacher directions with an answer guide and project ideas. Great for constructed response, bell-ringers, or science journals.
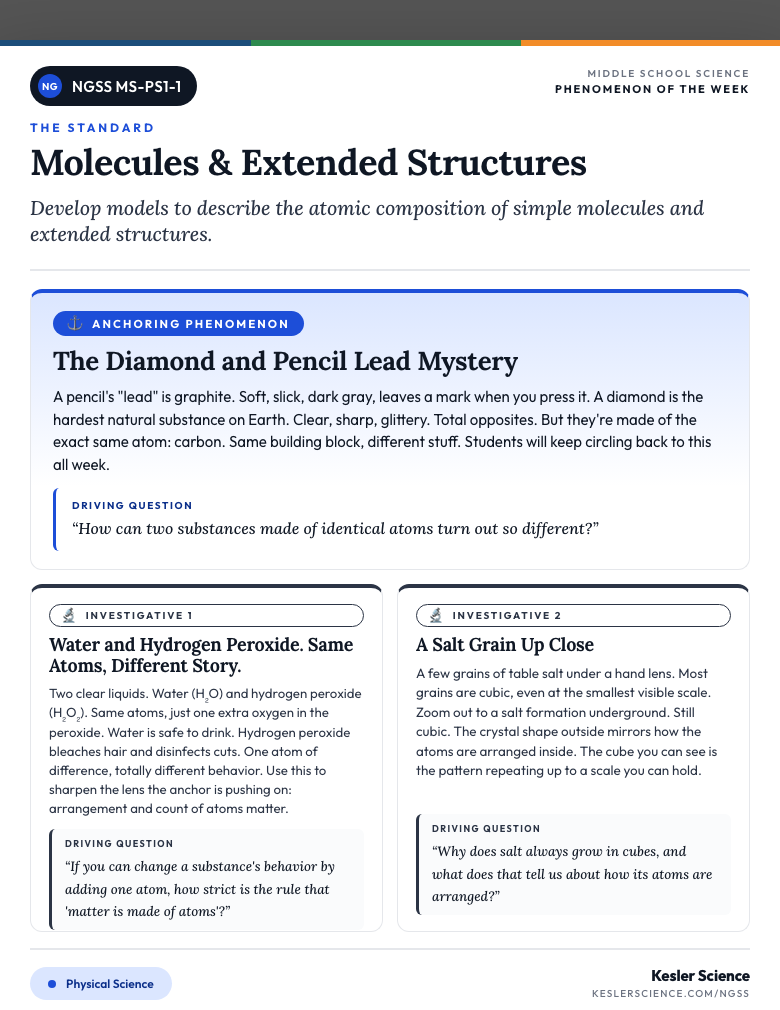
Teaching more than this one standard?
Get every I Can poster, phenomenon hook, and 3-dimension sheet for all 16 5th Grade standards, in one download. The whole year, ready to print.
📚 Vocabulary Students Need for 5-ESS2-2
The terms students need to access this standard. Definitions in plain-English, classroom-ready language.
💡 Free Engagement Ideas for 5-ESS2-2
100 Cups Water Sort
Groups set out 100 small cups of water to stand for all of Earth's water. Following the real amounts, they label 97 as salt-water ocean and 3 as fresh, then split the fresh into glaciers, groundwater, and the tiny lakes-and-rivers share. Seeing the cups physically separated makes the lopsided distribution impossible to miss. This is the anchor turned into a hands-on sort.
Build-the-Bar-Graph Lab
Using the amounts from the cup sort, 5th graders build a bar graph of Earth's water reservoirs. They scale each bar to its amount, so the ocean bar runs off the top of the page and the rivers bar is barely a line. They finish by writing one sentence using the graph as evidence about where Earth's water is.
Salt-Water Taste Test
5th graders compare a tiny taste of fresh water to a tiny taste of salt water (a safe pinch of salt stirred in). The point lands fast: the ocean is most of Earth's water, but the salt makes it undrinkable, so the small fresh share is what really matters. Connects the amount of salt water to why so little is usable.
Melt-the-Glacier Measure
Groups count out a set number of ice cubes (the glacier), predict how much liquid water they will make, then measure the melted water and compare. It shows that most fresh water is frozen and far away, so even the small fresh share is mostly locked up. A clean way to bring measuring and recording into the lesson.
📝 Assessment Ideas for 5-ESS2-2
Three short tasks that hit all three dimensions. Doable in one class period each.
Give 5th graders the amounts of water in each reservoir (ocean, glaciers, groundwater, lakes and rivers). They build a bar graph that scales each bar to its amount, then write one sentence using their graph as evidence about the distribution of Earth's water. Mirrors the standard: describe and graph amounts to provide evidence.
Show 5th graders a finished graph of Earth's water reservoirs. They answer which reservoir holds the most water, whether it's salt or fresh, and how the usable fresh-water share compares to the ocean. No new lab needed, just reading the proportions off the graph and explaining what they show.
Students write a short claim-and-evidence answer to the question "Why is so little of Earth's water usable?" They must point to amounts from the graph, the salt in the ocean share, and the frozen glacier share. Checks whether they can use the proportions as evidence, not just name the parts.
🎯 What Proficient Student Work Looks Like
Same prompt, three student responses at different proficiency levels. Use as anchor papers when scoring.
"Use your graph of Earth's water to explain how the amounts of salt water and fresh water are distributed on Earth, and why so little of it is usable."
- A specific claim backed by data or observation
- Use of standard-specific vocabulary in context
- Connection between what students observe and the underlying science idea
- A question they're still wondering about (curiosity stays alive)
"There is a lot of salt water and a little fresh water. The ocean is the biggest. We can't drink the ocean because it's salty."
Gets the direction right (more salt than fresh, ocean biggest) but uses no real amounts and never points to the graph. The fresh-water share isn't broken down, and there's no evidence from the data. It reads more like a guess than a graph reading.
"My graph shows the ocean has about 97 out of 100 parts and it's salt water. The fresh water is only about 3 parts. The ocean bar is way taller than the rivers bar. This is evidence that most of Earth's water is salty, so only a tiny part is fresh enough to drink."
Uses real amounts from the graph as evidence and compares the bar sizes. Connects the big salt-water share to why so little is usable. This is exactly what the standard asks a 5th grader to do.
"On my graph the ocean bar is about 97 parts of salt water and the fresh water is only about 3 parts. Out of that 3, most is frozen in glaciers or stuck underground, so the lakes-and-rivers bar is the tiniest one. My evidence is that the ocean bar is way bigger than all the fresh-water bars put together. So even though Earth looks like a water planet, almost none of the water is fresh AND unfrozen. That's why so little of it is usable."
Backs the claim with specific amounts AND breaks the fresh-water share into frozen, underground, and usable. Compares the proportions across all the bars and explains why the usable splash is so small. Reaches the scale-and-proportion idea without being asked.
“Next Generation Science Standards” is a registered trademark of WestEd. Neither WestEd nor the lead states and partners that developed the Next Generation Science Standards were involved in the production of, and do not endorse, this product.
NGSS performance expectations © 2013 Achieve, Inc. The Disciplinary Core Idea, Science and Engineering Practice, and Crosscutting Concept descriptions are reproduced from A Framework for K-12 Science Education with permission from the National Academies Press.
Trusted Across NGSS States
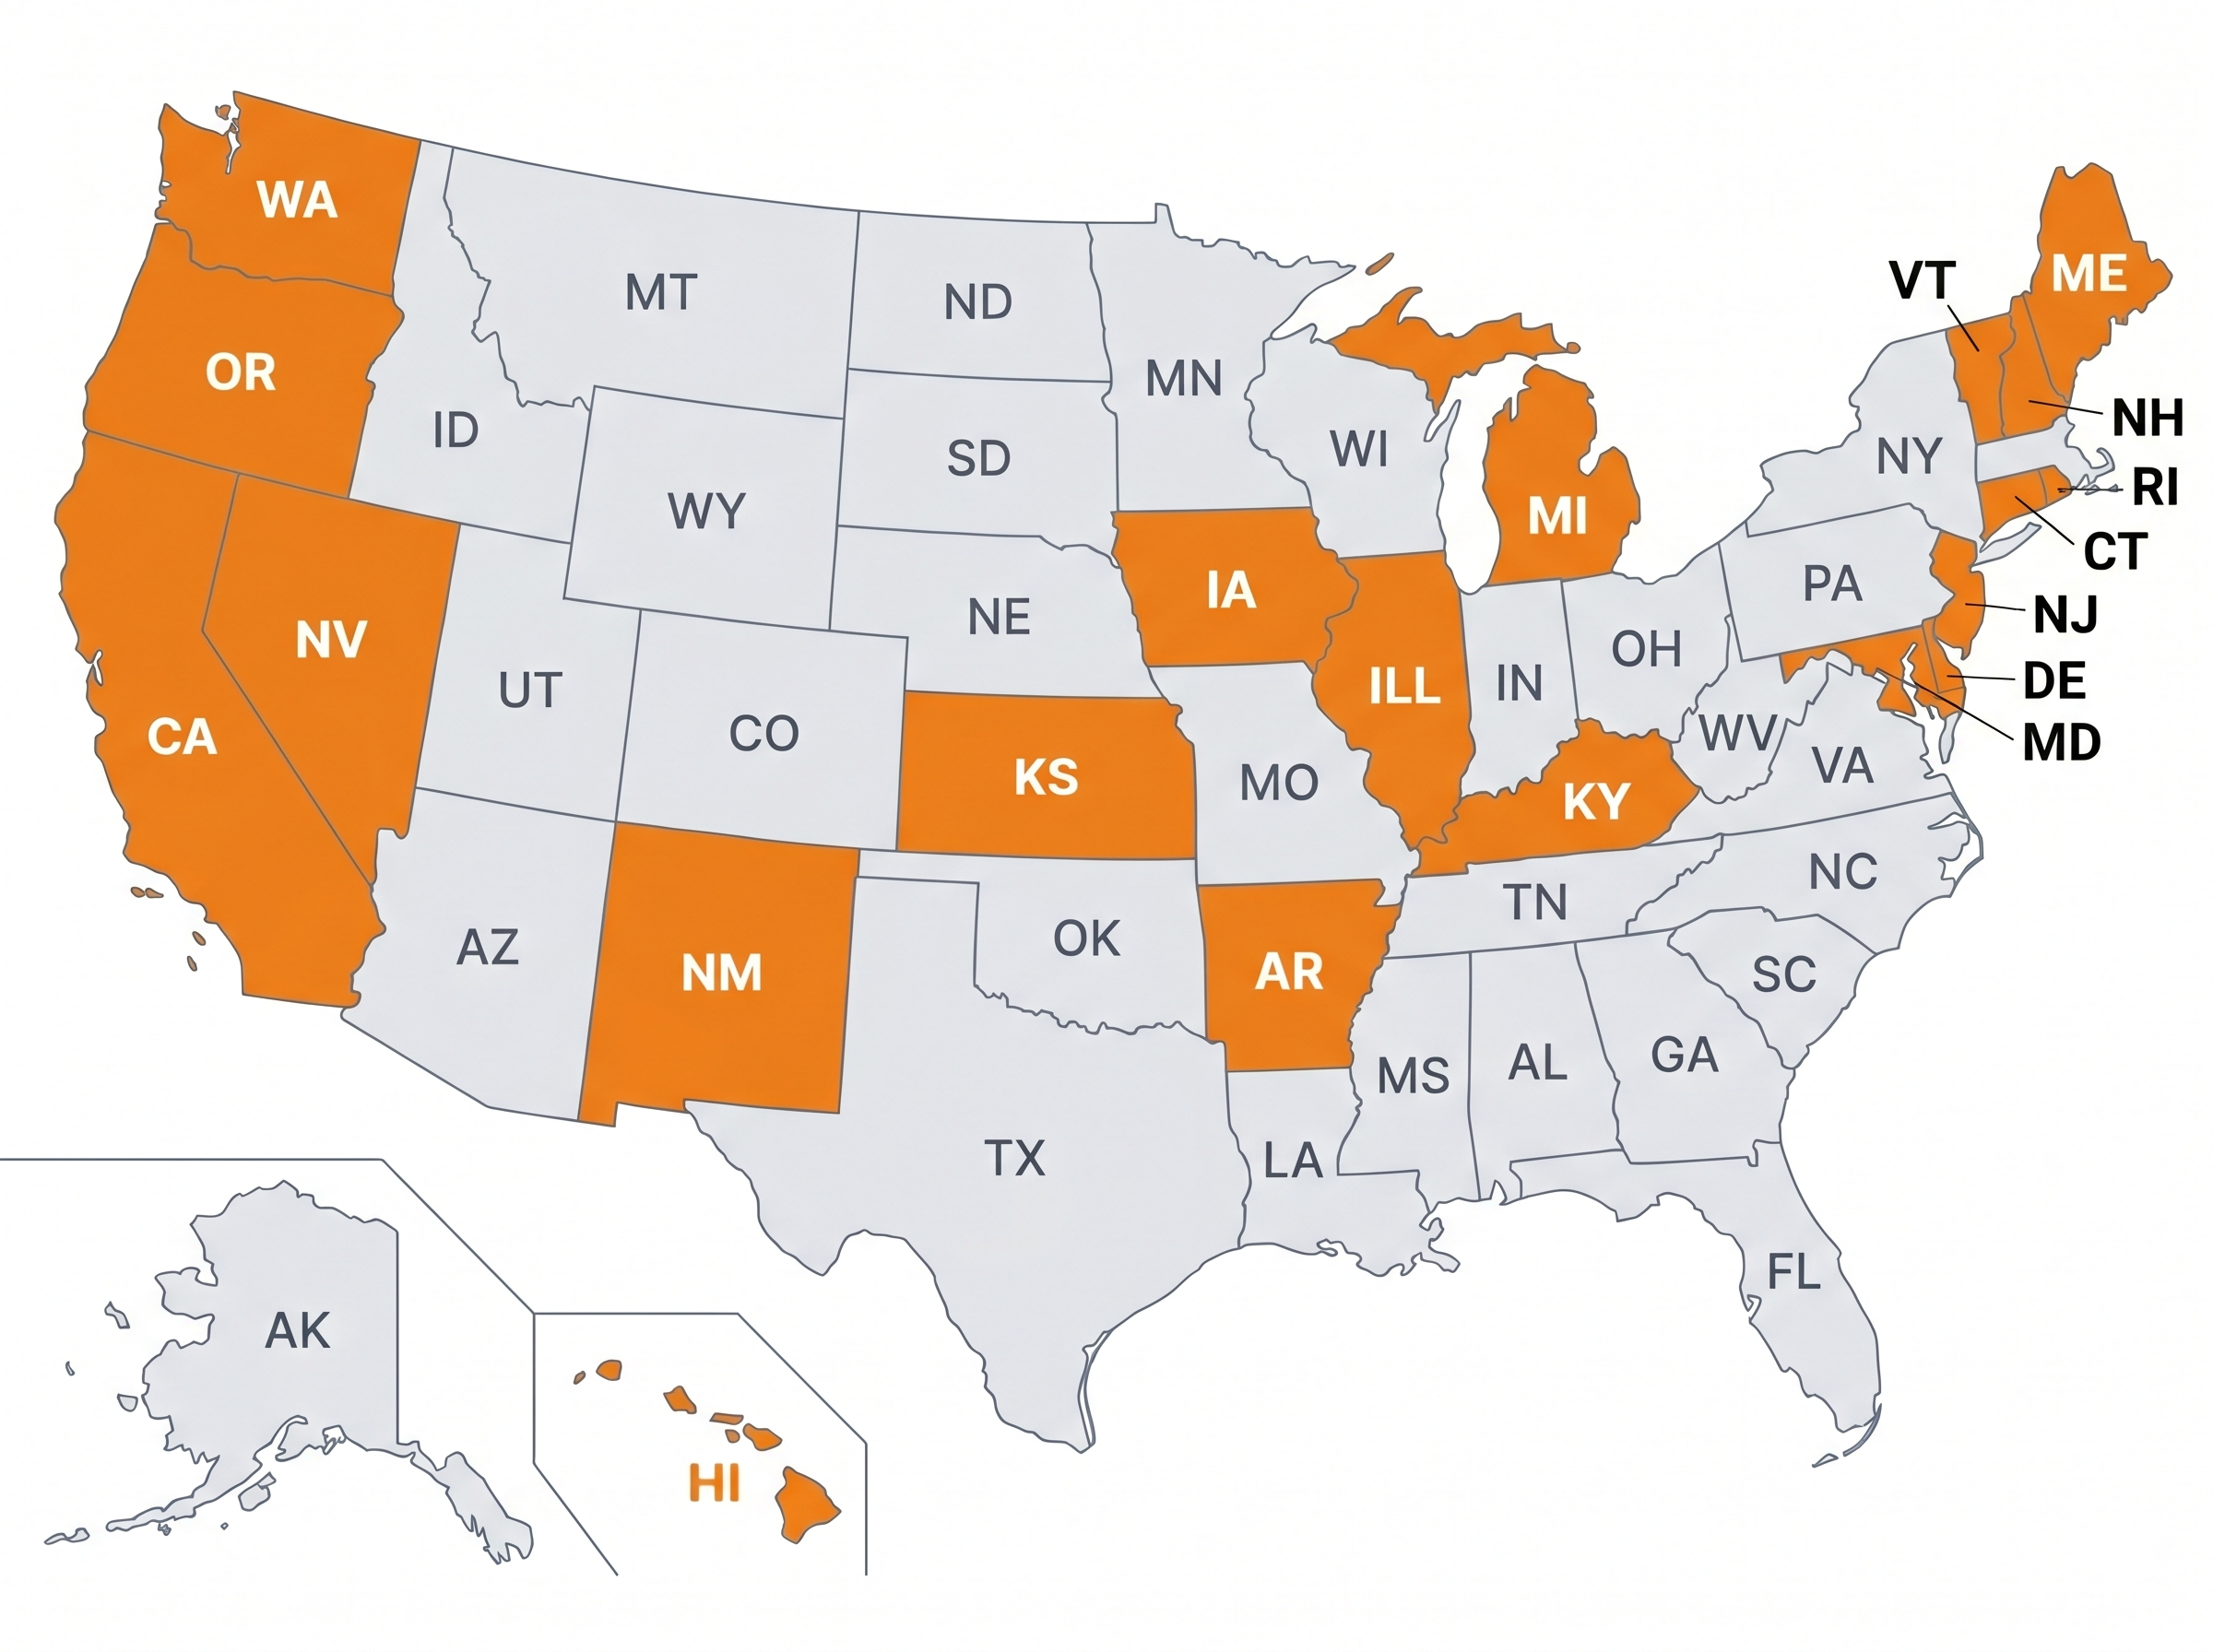
From California to Connecticut, science teachers in the 20 states that adopted NGSS are using Kesler Science to save time and engage students.
Teachers in NGSS States
Love Kesler Science
What Teachers Are Saying
"I'm able to access rigorous NGSS-aligned lessons and labs that are ready to use, so I spend more time helping students directly and less time searching for quality material."
"There's a lesson for each of the NGSS, so I don't have to search for hours to find a good quality lesson. I can spend more time actually teaching."
"The resources help me cover NGSS in a meaningful way, and my students gain a deeper knowledge of the concepts, with learning that's more self-driven."
Give Your Science Teachers Everything They Need
School and district licenses give your teachers access to every resource they need, including station labs, inquiry labs, anchoring phenomena, presentations, escape rooms, and much more. One purchase covers the grade levels you need.
- PO-friendly. We accept purchase orders
- Volume discounts for 11+ teachers
- Complimentary membership orientation for 4+ teachers
- Three free implementation PD sessions for departments of 11+
- Aligned to the NGSS standards
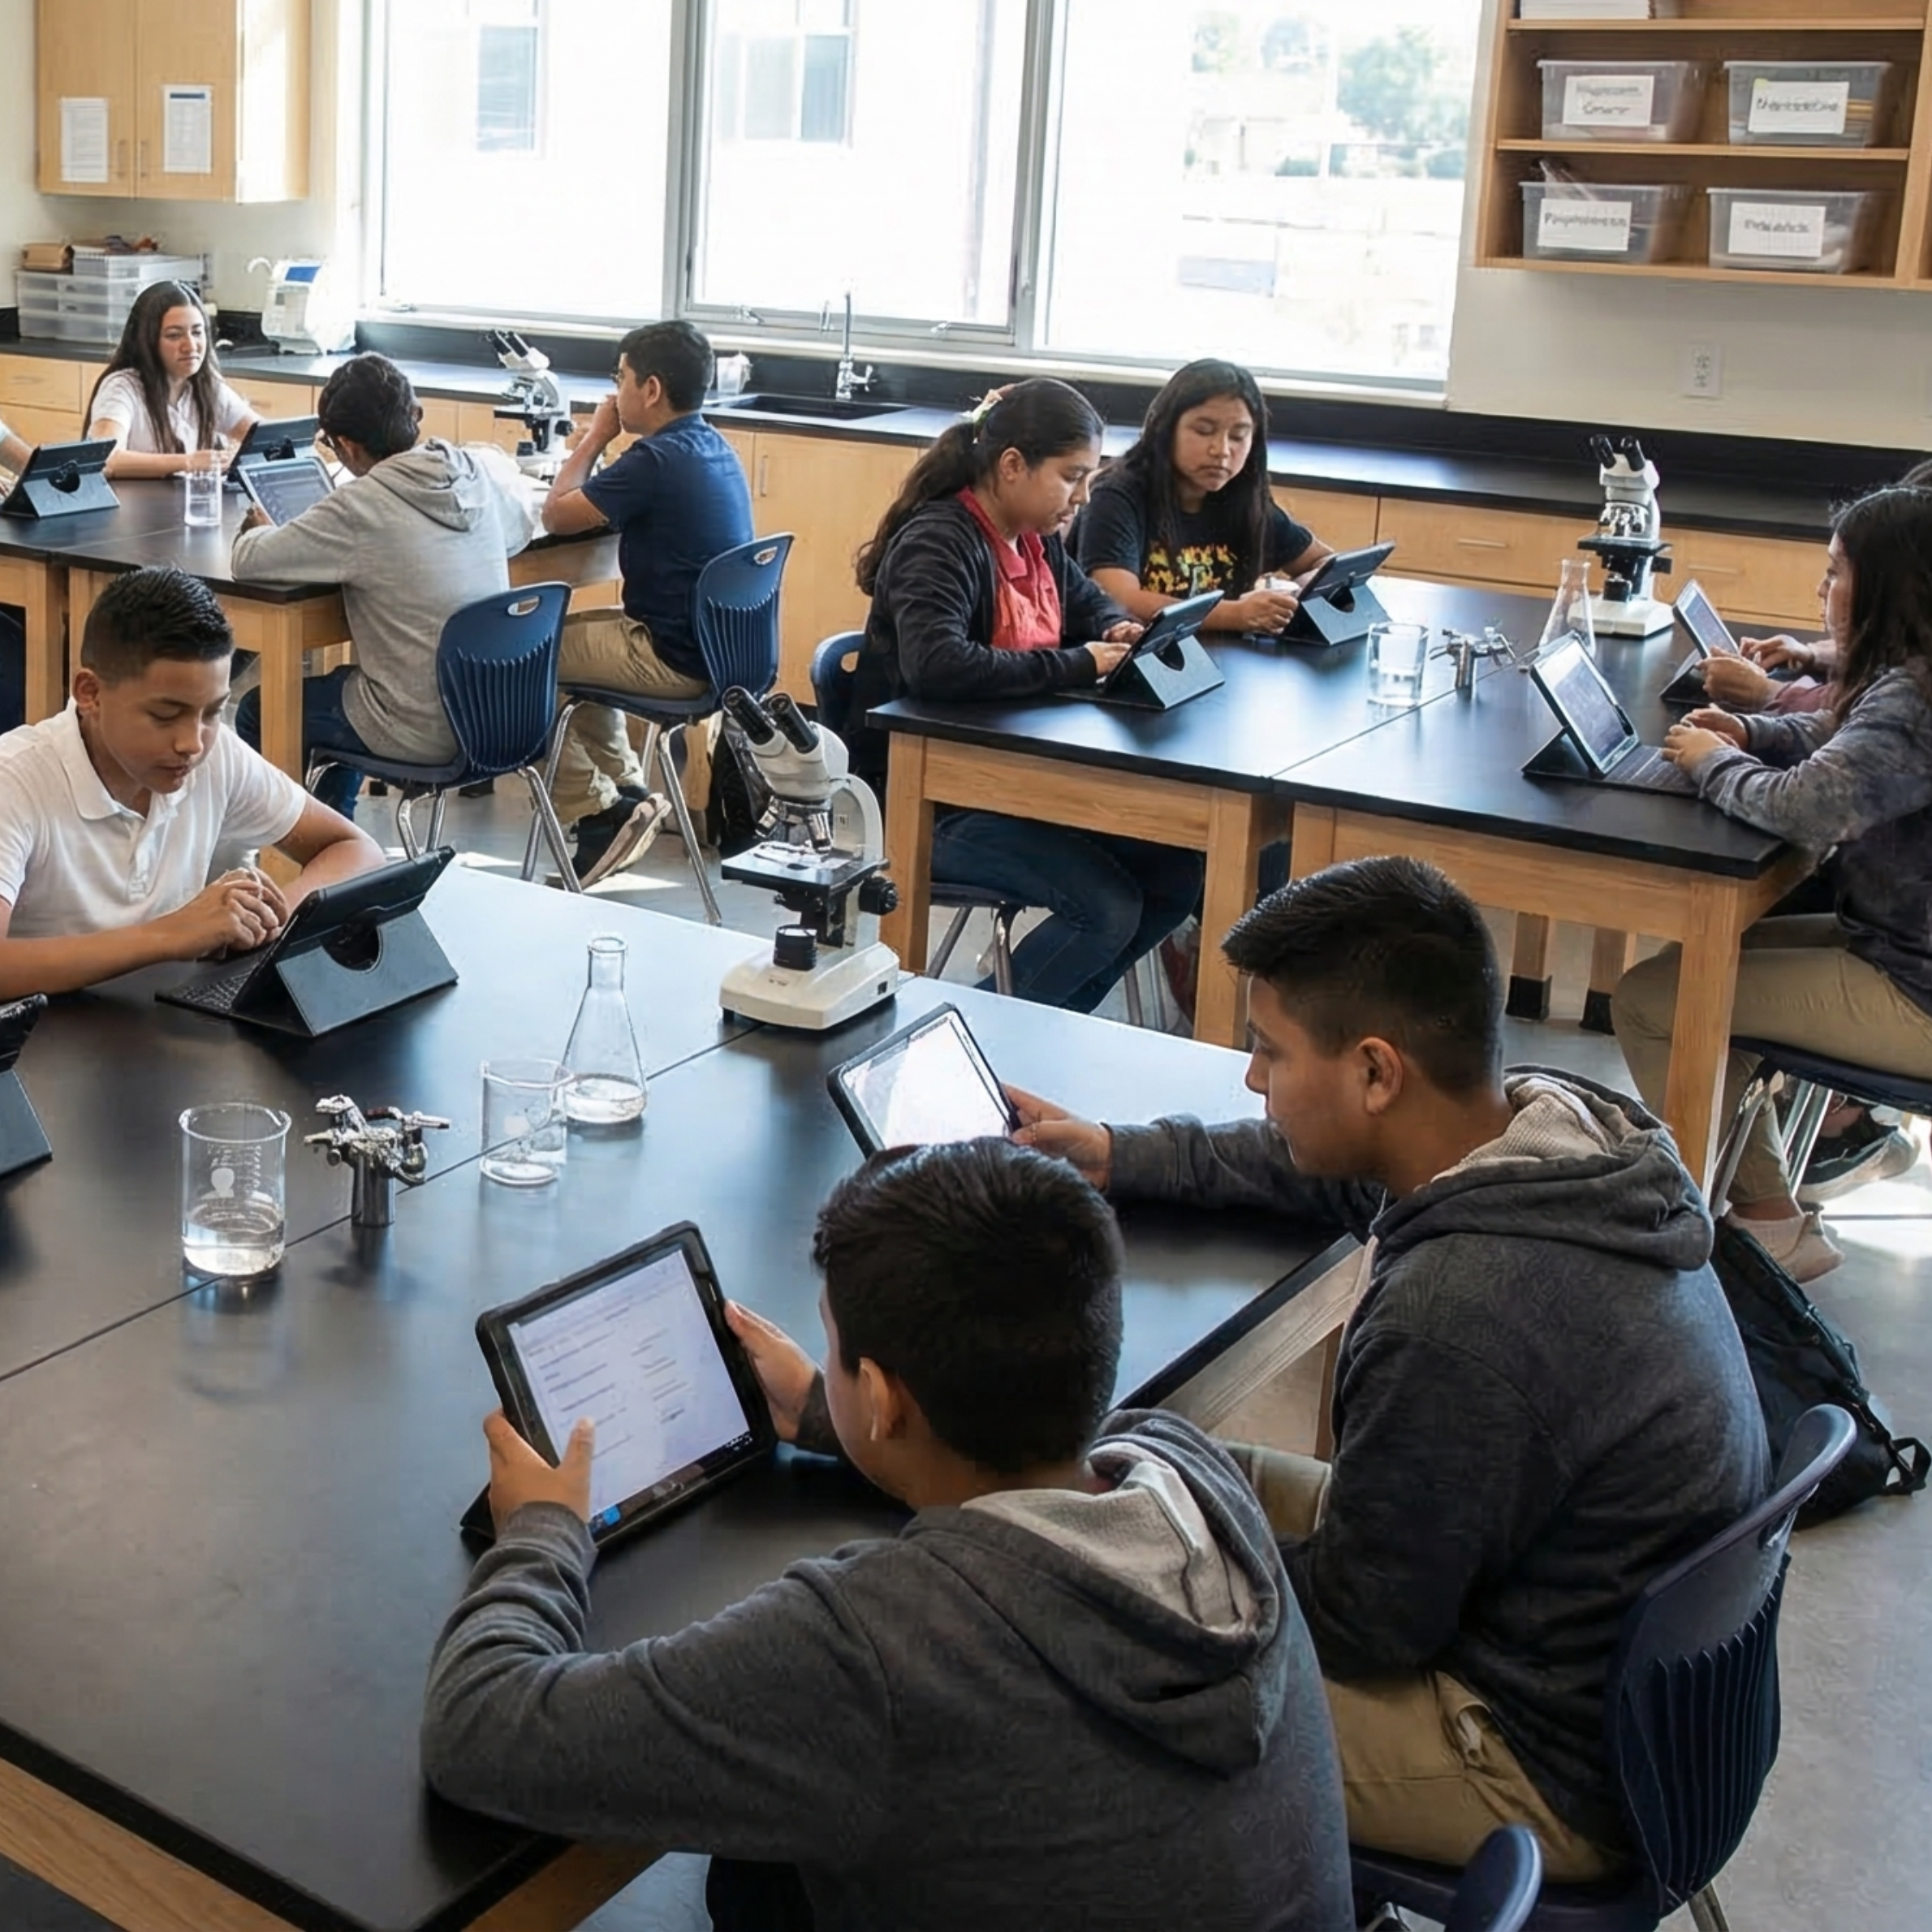
See It in Action
Book a walkthrough and we'll show you how Kesler Science fits your campus.
Book Demo CallNo pressure, no hard sell
"My assistant principal stopped in my room and immediately noticed how the students were engrossed in their centers and how they moved seamlessly from center to center. Also the built-in modifications really impressed!"
"It provides differentiated instruction for all types of learners, allowing them to become more engaged."
"I love it all!! I have become a facilitator in my class and I love the excitement it brings to my class. The kids love all that we do with the Kesler products."