
8 hands-on stations for teaching how the Sun drives weather and climate
A station lab is a student-led activity where small groups rotate through 8 stations (plus a 9th challenge station for early finishers) at their own pace during one to two class periods. You become a facilitator instead of a lecturer. You walk around, spot-check, and break misconceptions while kids work through the rotation.
The Energy from The Sun Station Lab has four input stations (where students take in new info on solar energy, the water cycle, and atmospheric circulation) and four output stations (where they show what they learned). Here's what's at each one.
4 input stations: how students learn about energy from the Sun
A short YouTube video (the first 3:45) walks students through how sea surface temperature, surface winds, and air temperature affect evaporation; how clouds and water vapor act as insulators; and what factors influence storm growth and global climate. Three questions follow. Visual learners come alive at this station.
A one-page passage called "Sun, Sea, and Sky: Understanding Texas Weather and Climate" frames the standard around something Texas kids actually know — the Gulf of Mexico, Panhandle northers, hurricane season, and humid summer days. Three multiple-choice questions follow plus a vocabulary task. Comes in two reading levels (Dependent and Modified) plus a Spanish version.
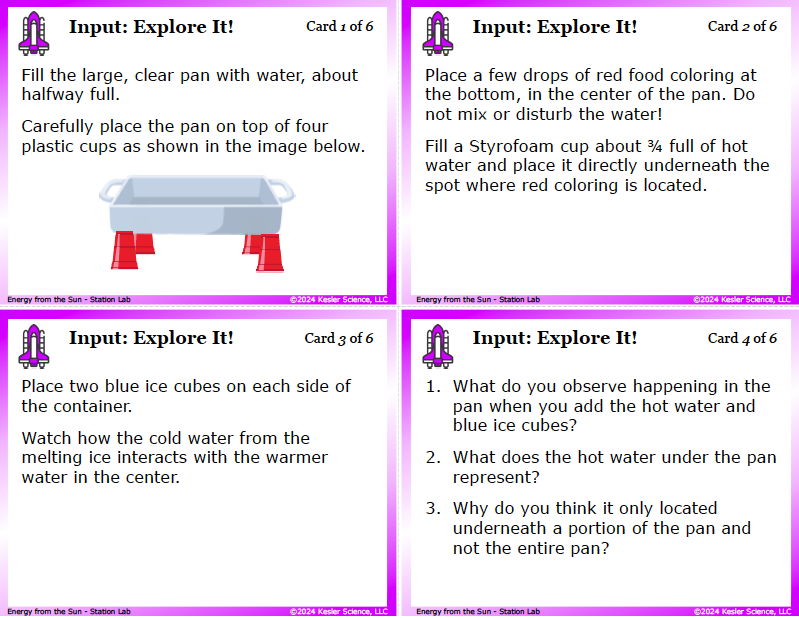
This is the heart of the lab. Students build a convection demo with a clear pan, four plastic cups, red food coloring, hot water in a Styrofoam cup, and blue ice cubes. The pan sits on the cups (so the hot water cup fits underneath). Hot water under one spot makes the red dye rise; the blue ice on each side sinks and pushes cold water across the bottom. Five questions follow about what's happening, what the hot water represents, why it's only under part of the pan, how this models Earth's atmosphere, and how convection affects regional weather and climate. By the end, kids have built a working convection cell.
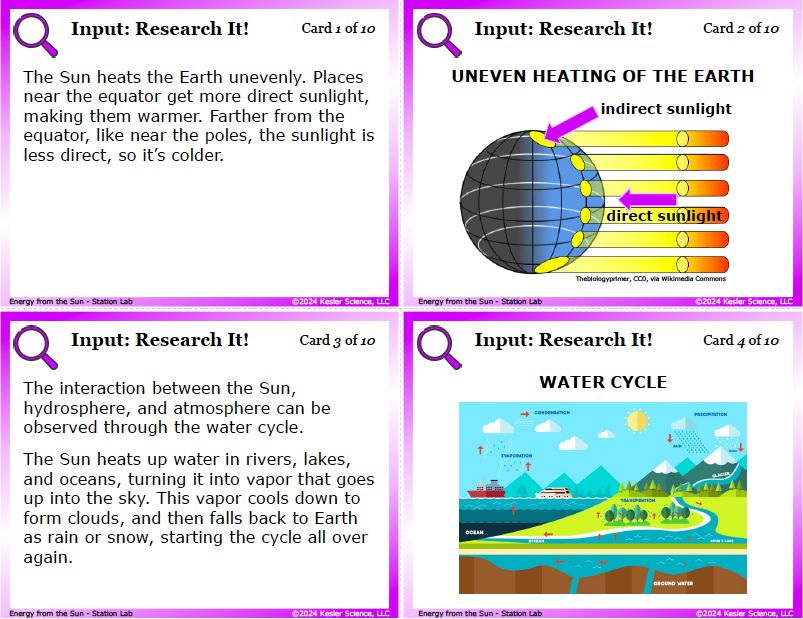
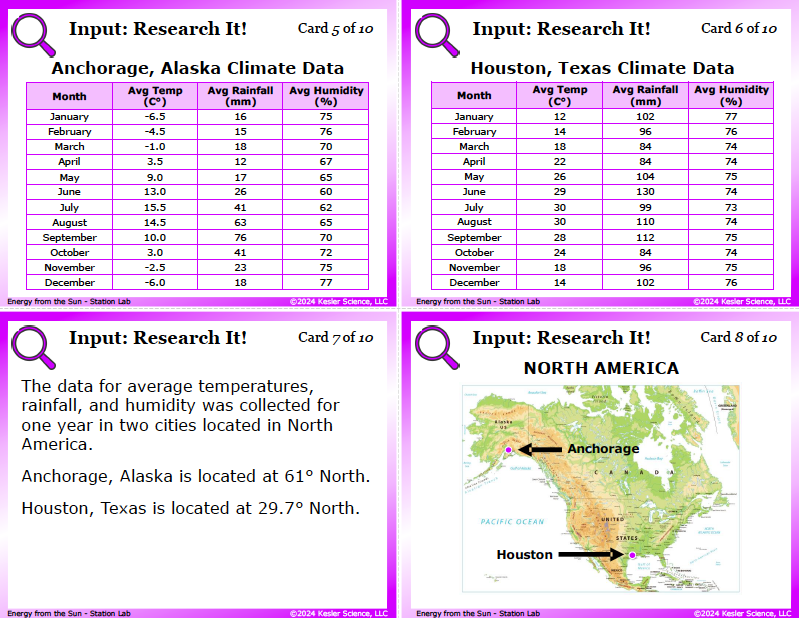
Students examine 10 reference cards covering uneven heating of Earth (with a clear direct-vs-indirect-sunlight diagram), the water cycle, and a full year of monthly climate data for Houston, Texas (29.7° N) and Anchorage, Alaska (61° N). Four questions ask them to compare angles of sunlight, predict how the water cycle differs between the two cities, connect average temperatures and rainfall to solar energy, and list factors that affect weather and climate. The Houston-vs-Anchorage data is the hook. Kids see the difference in numbers, not just words.
4 output stations: how students show what they learned
A Fact-vs-Fiction card sort. Kids match 12 statements as either fact or fiction. Facts include "the hydrosphere includes all of Earth's water" and "convection currents in the atmosphere can create thunderstorms." Fiction includes "solar energy heats the Earth's surface evenly," "weather describes the long-term atmospheric conditions," and "the poles of the Earth are colder because they are farther away from the Sun." That last one is the misconception you'll want to catch first.
Students draw the full Sun-hydrosphere-atmosphere system: the Sun reaching Earth, bodies of water evaporating, water vapor rising, clouds forming through condensation, and precipitation falling back down. They label every part with arrows. The drawing locks in the connection between the three spheres. Even kids who say "I can't draw" surprise themselves here.
Three open-ended questions: explain to a friend why Anchorage is colder and drier than Houston even during summer, describe how the water cycle connects the hydrosphere, atmosphere, and Sun, and explain how those three systems influence extreme weather and long-term climate trends. The Anchorage-vs-Houston question forces kids to use the Research It! data in their own words.
Eight multiple-choice and fill-in-the-paragraph questions tied to TEKS 8.10A vocabulary (weather, climate, solar energy, hydrosphere, atmosphere). Includes a primary-energy-source question, an atmosphere-role question, and a hydrosphere-role question. The fill-in paragraph weaves all five vocabulary words into one connected story. If you're grading the lab, this is the easiest station to grade.
Bonus Challenge It! station for early finishers
Four optional extensions: build a 10-word vocabulary crossword (paper or digital), conduct an imagined interview with a meteorologist or climatologist about local weather, design an album cover representing the Sun-hydrosphere-atmosphere interactions, or research and present an extreme weather event (hurricane, tornado, blizzard) focused on the role of the atmosphere and hydrosphere. Requires teacher approval before they start.
How this fits into a complete energy from the Sun unit
This Station Lab is the Explore day of our full Energy from The Sun Complete 5E Lesson for TEKS 8.10A. The complete two-week unit follows the 5E method of instruction and includes an Engage hook, the Energy from The Sun Station Lab for Explore, PowerPoint slides and interactive notebook pages for Explain, student choice projects to Elaborate, and an Evaluate assessment.
Most teachers grab the full 5E because the Station Lab lands hardest with the days around it. But if you just need a strong hands-on day on how the Sun, hydrosphere, and atmosphere drive weather and climate, the Station Lab on its own does the job.

Get this energy from the Sun activity

Or if you want the full two-week experience with the Engage hook, Explain day, Elaborate extension, and Evaluate assessment all included:
(Station Lab is included)
Frequently asked questions
What does TEKS 8.10A cover?
Texas TEKS 8.10A is a Readiness Standard that asks 8th grade students to describe how energy from the Sun, hydrosphere, and atmosphere interact and influence weather and climate. Students should be able to explain uneven heating of Earth, how the Sun drives the water cycle, how the atmosphere circulates heat and moisture, and how all three systems work together to create the weather and climate we experience.
What's the difference between weather and climate?
Weather is what's happening in the atmosphere right now or this week — today's high, tomorrow's chance of rain, this weekend's cold front. Climate is the long-term pattern in a region — Houston averages 30°C in July, Anchorage averages -6.5°C in January. The Read It! passage frames it as "day-to-day" vs. "long-term atmospheric conditions." Kids mix these two up constantly. Catch it early.
How long does this energy from the Sun activity take?
One to two class periods (45 to 110 minutes total). Plan for two periods the first time you run a station lab. Once your class has the routine down, most groups can finish all 8 stations in one period.
Do I need to provide my own materials?
The Explore It! convection demo needs a clear pan, plastic cups, a Styrofoam cup, hot water, blue ice cubes (made ahead with food coloring), and red food coloring. Total cost for a class of 30: under $15 if you don't already have the pan. Make the blue ice cubes the night before.
Can I use this in a 1:1 digital classroom?
Yes. The full digital version (PowerPoint or Google Slides) works in 1:1 classrooms and Google Classroom. The convection Explore It! demo can be replaced with a video of a convection-current demo or a digital simulation. The Houston-vs-Anchorage climate data, the uneven heating diagram, and the water cycle all live in the digital slides.