
8 hands-on stations for teaching global atmospheric movement
A station lab is a student-led activity where small groups rotate through 8 stations (plus a 9th challenge station for early finishers) at their own pace during one to two class periods. You become a facilitator instead of a lecturer. You walk around, spot-check, and break misconceptions while kids work through the rotation.
The Atmospheric Movement Station Lab has four input stations (where students take in new info on global circulation, the Coriolis effect, and pressure systems) and four output stations (where they show what they learned). Here's what's at each one.
4 input stations: how students learn about global atmospheric movement
A short YouTube video walks students through air masses, jet streams, and how meteorologists use them. Three questions follow: why air masses have different temperatures, why jet streams only travel from west to east, and why meteorologists monitor the jet stream. Visual learners come alive at this station.
A one-page passage called "Navigating the Skies: The Power of Global Winds" frames the standard from a pilot's point of view: trade winds, westerlies, the Coriolis effect, El Niño, and how it all connects. Three multiple-choice questions follow plus a vocabulary task. Comes in two reading levels (Dependent and Modified) plus a Spanish version.
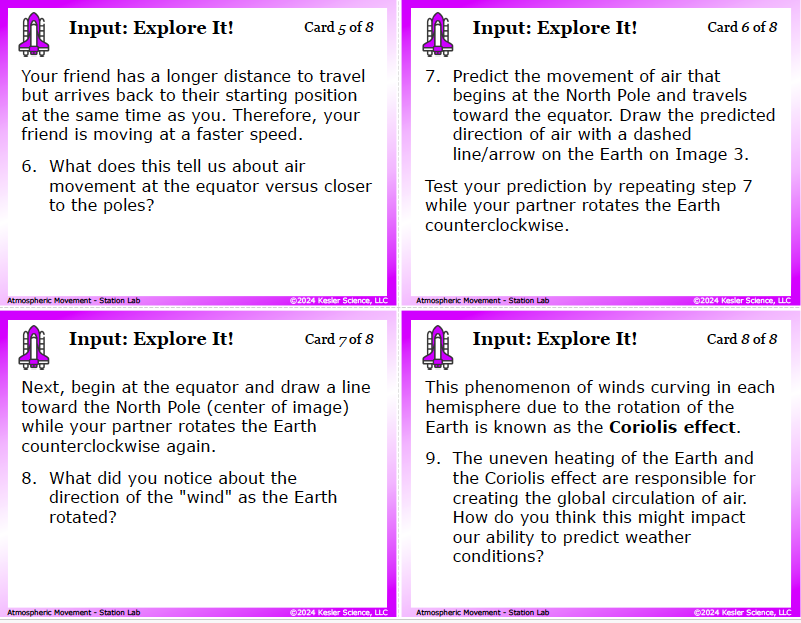
This is the heart of the lab. Students work with three printed images of Earth viewed from above the North Pole. They look at orbit and uneven heating (Image 1), then rotate the Earth counterclockwise to compare a person at 60°N with a person at the equator (Image 2). They figure out who travels farthest, who travels fastest, and what that tells them about air movement. Then they predict and draw the path of air moving from the North Pole to the equator while a partner spins the Earth (Image 3). Nine questions walk them all the way through. By the end, they've physically modeled the Coriolis effect with their hands.
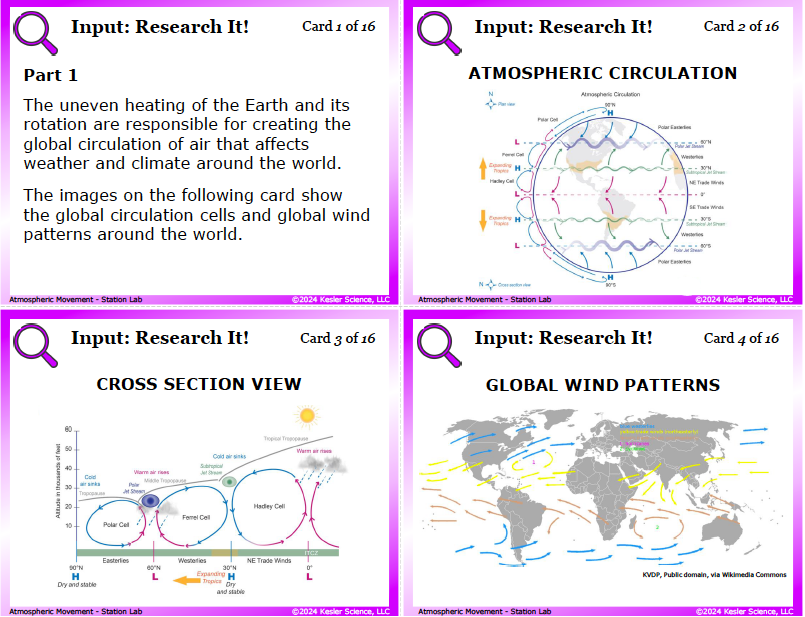
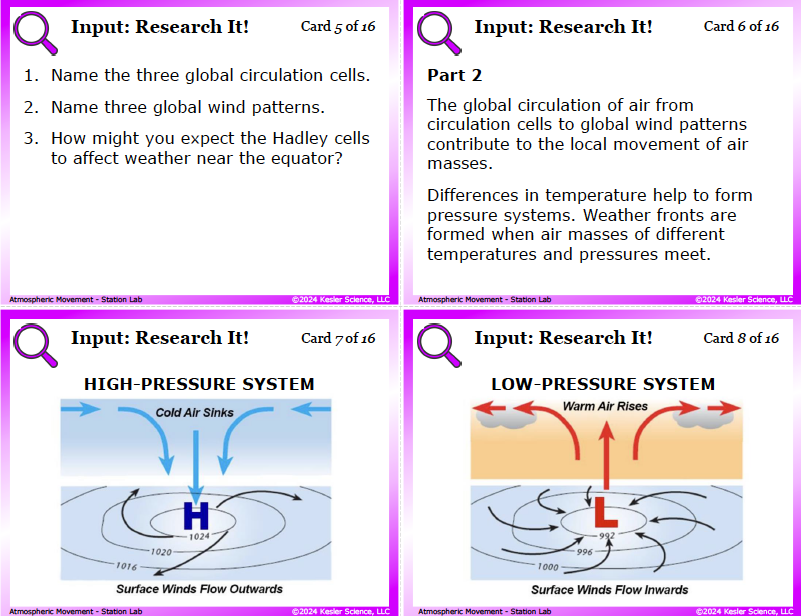
Students examine 16 reference cards split into two parts. Part 1 covers the three global circulation cells (Hadley, Ferrel, Polar), a cross-section view, and the global wind patterns map. Part 2 covers high- and low-pressure systems, cold and warm fronts, and two real before-and-after weather map sequences showing a cold front sliding across the Midwest from Monday to Tuesday. Seven questions tie it together. The before-and-after weather maps are the hook.
4 output stations: how students show what they learned
A term-to-image card sort. Kids match 8 terms (low-pressure system, high-pressure system, cold front, warm front, jet stream, global wind patterns, global circulation cells, Coriolis effect) with their correct symbol or image. Cold front = blue triangles. Warm front = red half-circles. The pressure system images show air spiraling in (low) or out (high). Easy to spot-check at a glance.
Students sketch a globe with latitude lines at 0°, 30°, and 60° in each hemisphere. They label and draw arrows for the trade winds (east to west between 30°N and 30°S), the westerlies (west to east between 30° and 60°), and the polar easterlies (east to west from 60° to the poles). The drawing locks the global wind belt pattern in. Even kids who say "I can't draw" surprise themselves here.
Three open-ended questions: how the Coriolis effect affects weather patterns on Earth, how trade winds differ from westerlies in their impact on weather, and how high- and low-pressure systems contribute to different weather. This is the writing practice middle schoolers need and rarely get in science class.
Eight multiple-choice and fill-in-the-paragraph questions tied to TEKS 8.10B vocabulary (global winds, Coriolis effect, trade winds, westerlies, atmosphere). Includes local-wind formation, jet streams, and a weather-systems-moving-west-to-east question. The fill-in paragraph weaves all five vocabulary words into one connected story. If you're grading the lab, this is the easiest station to grade.
Bonus Challenge It! station for early finishers
Four optional extensions: write a 10-question quiz with answer key, research a local wind phenomenon (monsoons, cyclones, typhoons, hurricanes, land and sea breezes), build a 10-word vocabulary crossword (paper or digital), or write an interview script with a meteorologist about how they use global wind patterns to predict weather. Requires teacher approval before they start.
How this fits into a complete atmospheric movement unit
This Station Lab is the Explore day of our full Atmospheric Movement Complete 5E Lesson for TEKS 8.10B. The complete two-week unit follows the 5E method of instruction and includes an Engage hook, the Atmospheric Movement Station Lab for Explore, PowerPoint slides and interactive notebook pages for Explain, student choice projects to Elaborate, and an Evaluate assessment.
Most teachers grab the full 5E because the Station Lab lands hardest with the days around it. But if you just need a strong hands-on day on global wind patterns and the Coriolis effect, the Station Lab on its own does the job.

Get this atmospheric movement activity

Or if you want the full two-week experience with the Engage hook, Explain day, Elaborate extension, and Evaluate assessment all included:
(Station Lab is included)
Frequently asked questions
What does TEKS 8.10B cover?
Texas TEKS 8.10B asks 8th grade students to identify global patterns of atmospheric movement (including jet streams, trade winds, and polar easterlies) and explain how they influence local weather. Students should be able to identify the three global circulation cells (Hadley, Ferrel, Polar), name and locate the trade winds, westerlies, and polar easterlies, explain the Coriolis effect, and read a basic weather map showing pressure systems and fronts.
Why does the Coriolis effect exist?
Earth rotates faster at the equator than at the poles (a person at the equator travels about 25,000 miles in 24 hours; a person near the pole travels almost nothing). When air moves north or south, the ground beneath it is moving at a different speed. From our point of view on the spinning Earth, the air looks like it's curving. In the Northern Hemisphere, winds curve to the right; in the Southern Hemisphere, they curve to the left. The Explore It! station has students physically rotate a paper Earth to model this with their own hands.
How long does this atmospheric movement activity take?
One to two class periods (45 to 110 minutes total). Plan for two periods the first time you run a station lab. The Explore It! Coriolis demo is the most time-intensive station because of the prediction-test-redraw loop. Once your class has the routine down, most groups can finish all 8 stations in one period.
Do I need to provide my own materials?
Almost nothing. The three Earth images and all 16 reference cards are included in the download. You'll just need pencils, erasers, and colored pencils for the Illustrate It! station. The Watch It! station also needs a device with internet.
Can I use this in a 1:1 digital classroom?
Yes. The full digital version (PowerPoint or Google Slides) works in 1:1 classrooms and Google Classroom. The Coriolis Explore It! demo can be replaced with a digital simulation or a video of an interactive globe. The before-and-after weather maps and the global circulation diagrams all live in the digital slides.