
Inside the Tropical Storms 5E Lesson
The 5E instructional model walks students through five phases: Engage, Explore, Explain, Elaborate, and Evaluate. It flips the traditional lecture-first sequence. Students explore a concept with their hands before you ever explain it, which means by the time you do explain it, they have something to hook the vocabulary onto.
I switched to the 5E model years ago and stopped going back. Kids retain more, ask better questions, and stop staring at me waiting to be told the answer. The Tropical Storms 5E Lesson is built on this framework from start to finish. Here's how it plays out across the five phases.
🎯 Engage
Day one is a teacher-led storm-tracking activity. Students get a blank map of the Atlantic basin and a real historical storm track (Harvey, Katrina, Ike, or one you choose), and they plot the storm's path day by day, noting wind speed and category at each point. As they plot, they start to see the storm intensify over warm water, weaken over land, and curve in a way that previews the Coriolis effect from 8.10B.
By the end of the period, kids have a hand-drawn storm track, a list of observations about where the storm strengthened and weakened, and at least one good guess about why. Nobody has heard a formal definition of "tropical cyclone" yet. That's the point. They're walking into the rest of the unit with a working mental model, not a memorized definition.
What's included in the Engage:
- Teacher directions for the storm-tracking activity
- Printable storm tracking map and historical data set
- Answer key for the discussion questions
- Four learning objective slides (standard verbatim, the academic verb highlighted, "I CAN...", and "WE WILL...")
- An illustrated Weather & Climate Word Wall in English and Spanish covering the unit vocabulary
🔬 Explore
The Tropical Storms Station Lab is the heart of the Explore phase. Students rotate through 8 stations (plus a 9th challenge station for early finishers) over one class period. The Station Lab is split into four input stations (where kids take in new information) and four output stations (where they show what they learned).
The four input stations:
- 🎬 Watch It! — Students watch a short video on how hurricanes form, intensify, and dissipate, with guided viewing questions.
- 📖 Read It! — A one-page reading passage on hurricanes, typhoons, and cyclones at two differentiated levels, with a Spanish version included.
- 🔬 Explore It! — A hands-on storm-fuel investigation where students model how warm water releases water vapor into the air, fueling a storm.
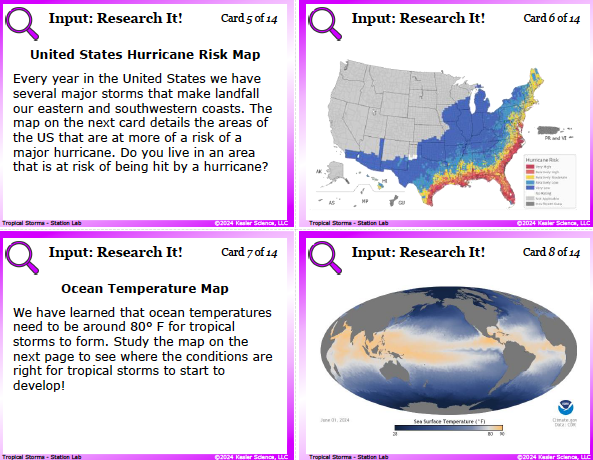
- 💻 Research It! — Reference cards on the Saffir-Simpson scale, storm anatomy (eye, eyewall, rainbands), and storm-surge mapping.
The four output stations:
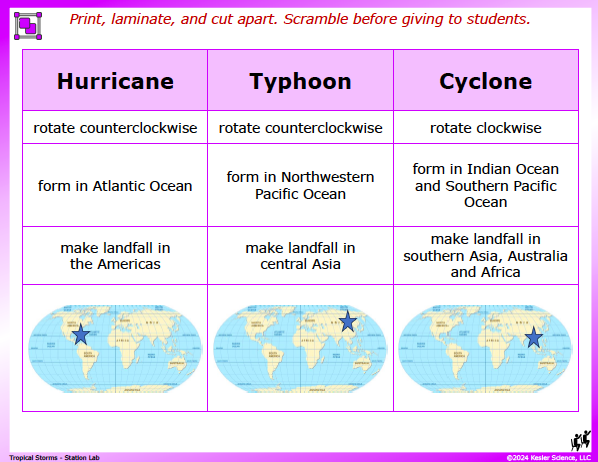
- 📋 Organize It! — A card sort where students place storms into hurricane, typhoon, or cyclone based on where they formed.
- 🎨 Illustrate It! — Students draw a cross-section of a hurricane, labeling the eye, eyewall, rainbands, and the direction of rotation.
- ✍️ Write It! — Three open-ended questions in complete sentences (this is where you see who really gets it).
- 📝 Assess It! — A short formative check with multiple choice and a fill-in-the-blank vocabulary paragraph.
Print and digital versions are both included. If you want the full breakdown of what happens at every single station, what students produce, and how to set it up, that's in our dedicated Station Lab post.
→ Read the full Tropical Storms Station Lab walkthrough 8 stations, materials list, teacher tipsThe Station Lab is included in the full 5E lesson. You don't need to buy it separately if you're getting the whole unit.
📚 Explain
Here's the real payoff of doing the Engage and Explore before the Explain: by the time kids hit this phase, they've already plotted a real storm track and watched warm water push water vapor into the air. They have a working understanding before you ever start naming things. The discussions get deeper, the questions get sharper, and you spend less time defining and more time pushing their thinking.
The Tropical Storms Presentation walks 8th graders through the full scope of TEKS 8.10C, one concept at a time. The deck opens with the role of the oceans. Oceans store enormous amounts of heat, and that heat is the fuel for storm systems. When warm seawater meets warm, moist air, you get the conditions that produce tropical cyclones. Students learn that hurricanes, typhoons, and cyclones are the same storm with different regional names: hurricanes form in the Atlantic and Eastern Pacific, typhoons in the Western Pacific, and cyclones in the Indian Ocean and near Australia. Same science. Different mailing address.
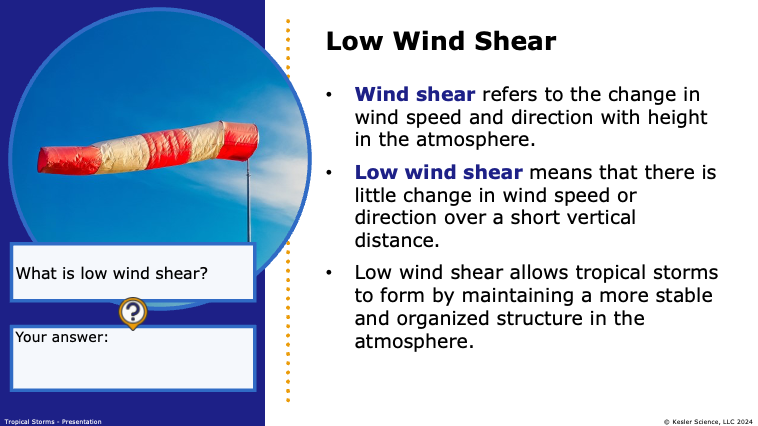
From there, the deck builds out the recipe for storm formation. Tropical storms need sea-surface temperatures of about 80 degrees Fahrenheit (27 degrees Celsius) down to a depth of roughly 50 meters, plenty of moist air, and low wind shear so the storm can keep a tall, organized structure. They also need to form at least several degrees of latitude away from the equator so the Coriolis effect can spin up the rotation. Warm water evaporates, rises as water vapor, condenses into towering thunderstorms, and releases huge amounts of latent heat. That released heat is the storm's engine, which is why hurricanes weaken so fast once they move over land or cold water. They lose their fuel.
The deck then turns to storm anatomy. Every mature tropical cyclone has three key parts: the eye, the calm, often clear center where air is sinking; the eyewall, the ring of towering thunderstorms surrounding the eye with the strongest winds and heaviest rain; and the rainbands, the spiral arms that fan out from the storm and produce bands of rain and gusty wind. Students learn that the eye is the calmest part, not the most dangerous, and that the most catastrophic damage usually comes from the storm surge (a wall of ocean water pushed inland by the storm), rainfall flooding, and tornadoes spun off in the rainbands. Harvey is the Texas case study: by sustained winds it was a Category 4, but the catastrophic damage came from days of stalled rainfall after landfall.
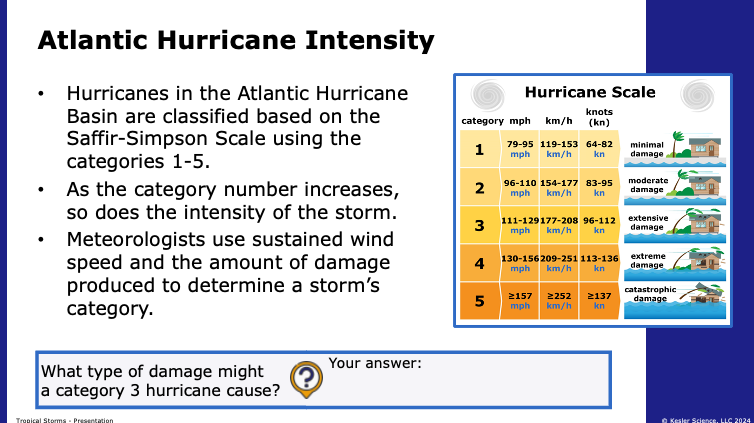
Finally, the deck covers how scientists classify and track these storms. The Saffir-Simpson Hurricane Wind Scale rates hurricanes Category 1 through 5 based on sustained wind speed, with Category 5 storms producing winds of 157 mph or higher. Forecasters use a combination of satellite imagery, ocean buoy data, reconnaissance aircraft (the famous "Hurricane Hunters") that fly directly into the storm, and computer models that run multiple scenarios to predict the cone of probable paths. The deck closes by tying tracking and prediction back to the kinds of decisions emergency managers make in Texas, Louisiana, and Florida every hurricane season.
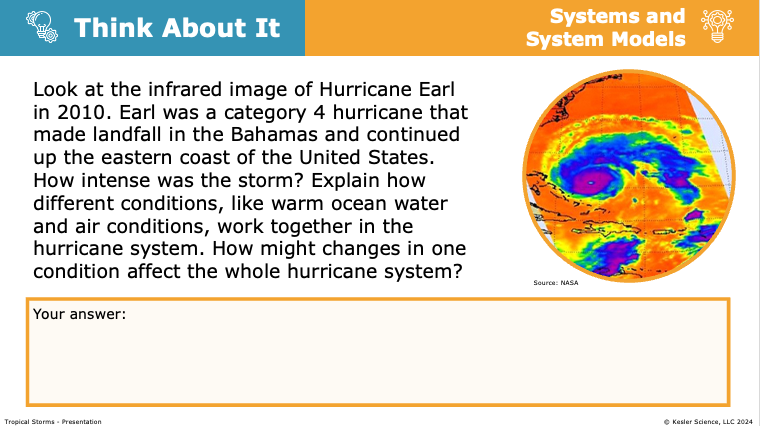
What makes this Presentation different from a typical Earth science slideshow is that kids are doing something on almost every slide. It's not a lecture deck. It's a participation deck. "Your answer:" prompts appear on most slides, Brain Breaks reset attention every few slides, Quick Action INB tasks (a labeled cross-section of a hurricane, a hurricane/typhoon/cyclone sort by location, a Saffir-Simpson matching activity) show up throughout, and Think About It prompts push deeper into bigger ideas like why a slow-moving Category 1 can sometimes do more damage than a fast-moving Category 5.
The Explain materials in this product include:
- An editable Presentation at two differentiated levels (Dependent and Modified), works in PowerPoint or Google Slides
- A guided fill-in-the-blank student notes handout that mirrors the Presentation, with answer key
- A Paper Interactive Notebook (English and Spanish) students cut, fold, and glue into their notebooks
- A Digital Interactive Notebook at both levels with answer keys, for 1:1 classrooms or Google Classroom
The Explain runs across two class periods. The built-in Think About It prompts are where the real discussion happens, so let those breathe.
🛠️ Elaborate
The Elaborate phase is where students stretch what they learned about tropical storms and put it into a project of their choosing. In this 8th grade weather and climate lesson, that's a Student Choice Project board with six different project options plus a "design your own" pathway.
Students might design a hurricane-preparedness flyer for a Texas Gulf Coast town, build a 3-D model of a hurricane with labeled eye, eyewall, and rainbands, or record a mock newscast tracking a fictional Category 3 hurricane making landfall. There are options for kids who love to write, kids who love to draw, kids who love to build, and kids who love to perform. Whatever the project, the point is the same: students apply tropical cyclone formation, structure, and tracking to a real-world artifact instead of a worksheet.
Choice is the whole point. By letting students pick how they show their thinking, you get more authentic work for TEKS 8.10C and you actually get to see what they understand about how oceans and air masses interact to produce these storms.
The rubric (the part teachers actually want)
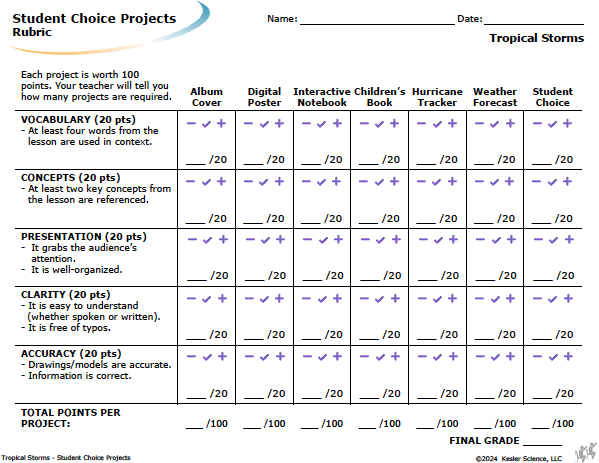
Every project, no matter which option a student picks, is graded on the same 100-point rubric. Five categories at 20 points each:
- Vocabulary (20 pts) — At least four words from the lesson are used in context.
- Concepts (20 pts) — At least two key concepts from the lesson are referenced.
- Presentation (20 pts) — The project grabs attention and is well-organized.
- Clarity (20 pts) — Easy to understand. Free of typos.
- Accuracy (20 pts) — Drawings and models are accurate. The science is right.
The rubric uses a minus / check / plus shorthand on every row so you can grade a stack of projects quickly without re-reading every criterion.
Two differentiated versions in one file
The standard version is for students ready for independent application of tropical-storm science. The Reinforcement version is for students who need additional vocabulary or concept support, with three of the six options swapped for projects with a tighter vocabulary tie-in, and "design your own" replaced with "collaborate with the teacher" so kids aren't pitching cold.
✅ Evaluate
The Evaluate phase wraps the unit with a formal assessment. It's not all bubble-in. Several questions hand students a satellite image of a hurricane or a Saffir-Simpson chart and ask them to read it.
The full assessment has 12 questions across five formats:
- Multiple choice (4 questions) covering storm formation conditions, the Saffir-Simpson scale, hurricane structure, and regional storm names
- Hotspot / visual (2 questions) where students click or circle the eye and eyewall on a satellite image and identify the storm's direction of rotation
- Multiselect (2 questions) where students pick all conditions required for a tropical storm to form or all hazards associated with hurricanes
- Short answer (2 questions) on why hurricanes weaken over land and why a Category 1 storm might cause more damage than a Category 5
- Multipart scenario (2 questions) with a real-world setup (a developing storm in the Gulf) where students predict the storm's path, intensity, and likely hazards
A modified version is included for students who need additional support, with fewer multiple-choice distractors and sentence-starter scaffolds on the short-answer items.
If you've taught all five phases, this assessment shouldn't surprise anyone. It's a chance for kids to show you they get it.
How everything fits together
If you want the whole experience (Engage hook, the Station Lab as the Explore, the Explain day with Presentation and interactive notebook, the Student Choice Elaborate, and the Evaluate assessment all in one download), that's the Tropical Storms Complete 5E Science Lesson.
If you only need the one-day hands-on activity, the Station Lab works as a standalone. Most teachers buy the full 5E because the Station Lab works harder when it's bookended by a strong Engage and a follow-up Explain. But both are honest options.

Get the Tropical Storms 5E Lesson

Or if you only need the one-day hands-on Station Lab:
(The Station Lab is included in the full 5E Lesson)
Frequently asked questions
Does this cover all of TEKS 8.10C?
Yes. The full standard is addressed across all five phases, with ocean-air mass interactions and storm formation baked into the Engage tracking activity, the Explore Station Lab, and the Presentation.
What do my students need to know before this lesson?
A basic understanding of ocean currents, air masses, and the Coriolis effect. Teaching TEKS 8.10A and 8.10B first sets this unit up perfectly.
How long does it take to teach?
Done with fidelity, about 10 class periods of 45 minutes each. One day for the storm-tracking Engage, two days for the Station Lab, two days for the Presentation and Interactive Notebook, three days for the Student Choice Project, and one to two days for review and the assessment. The product also ships with a compressed 8-day sample unit plan if you need to move faster.
Do I need special supplies?
The storm-tracking map is included. You'll need warm water, cold water, and clear cups for the Station Lab investigation, plus a device with internet to pull up satellite loops. Most teachers already have it all.
Does this work for digital classrooms?
Yes. Every component has a digital version. The Station Lab is fully digital-ready (Google Slides), the Presentation works in Google Slides, and the Student Choice Projects can be submitted as videos, slide decks, or written work.
Is this 5E lesson aligned to NGSS too?
It aligns with MS-ESS2-5 (collecting data to provide evidence for how the motions and complex interactions of air masses result in changes in weather conditions) and MS-ESS3-2 (forecasting natural hazards). Built TEKS-first, but the standards overlap heavily.