Motion Graphing Lesson Plan – A Complete Science Lesson Using the 5E Method of Instruction
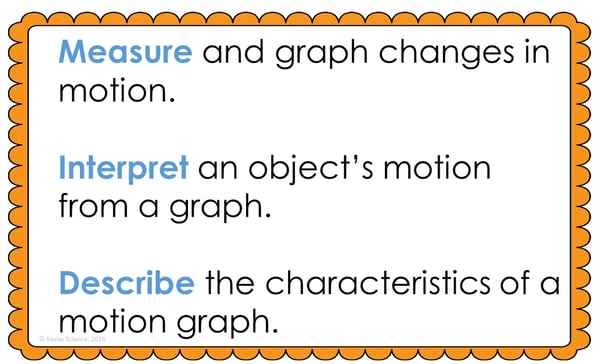
By the end of this lesson about motion graphing, students will be able to measure and graph changes in motion, interpret an object’s motion from a graph, and describe the characteristics of a motion graph. Each of our lessons is designed using the 5E method of instruction to ensure maximum comprehension by the students. This well-thought out unit does the heavy lifting, giving teachers easy-to-implement, highly engaging lesson plans.
This blog will walk you through each of the steps and activities from the Motion Graph 5E Lesson Plan.
ENGAGEMENT
Objective Introduction
At the beginning of the lesson, the class will do a Think-Pair-Share to discuss the objective.
Class Activity
Show a video (Title: Learning About Line Graphs)
Student Activity
- Have the students work with a partner to brainstorm ideas about the following questions. There is a PowerPoint slide with these questions called “1 Engagement – Questions for Class” in the download of this product.
- What makes a good graph?
- If you want to graph speed, what two variables would you use?
- If you want to graph acceleration, what two variables would you use?
- Sketch a graph of what you think a speed graph might look like.
- Ask for responses from each group.
- Explain that over the next few days students will be learning about graphing motion and interpreting motion graphs.
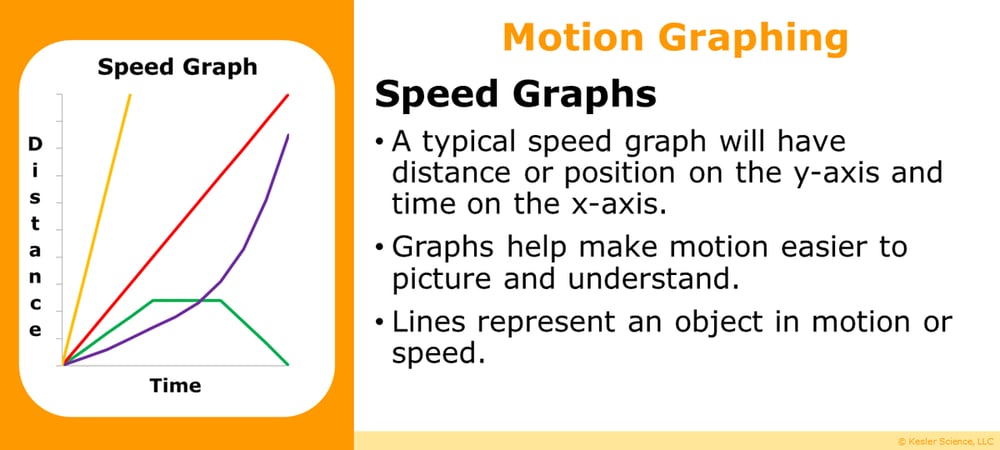
The teacher will help to clear any misconceptions about motion graphs. Some major misconceptions are that students think that a diagonal line on a d/t graph shows acceleration, a diagonal line on a v/t graph shows speed, the horizontal line on a d/t graph shows constant speed. and the horizontal line on a v/t graph shows stopping. This is partially true but doesn’t tell the whole story.
Estimated Class Time for the Engagement: 20-30 minutes
EXPLORATION
This student-centered station lab is set up so students can begin to explore motion graphing. With nine stations in total, you can introduce motion graphing to your middle school students in a variety of ways! Four of these stations are considered input stations where students will learn new information about motion graphing, and four of the stations are output stations where students will be demonstrating their mastery of the lesson's material. A bonus station offers challenges for your early finishers and independent learners. You can read more about how I set up the station labs here.
Watch It!
At this station, students will be watching a short video explaining motion graphing. Students will then answer questions related to the video and record their answers on their lab station sheet. For example: What does it mean when there is a curved line going upwards on a graph? Describe what no motion looks like on a graph. What does a line represent that is slanted down towards the x-axis?
Read It!
This station will provide students with a one-page reading about motion graphing. Students will also learn about how industries use motion graphs to track business analytics. Graphing motion does not only have to include cars and their motion. Students will learn that these graphs are useful in other ways as well. There are four follow-up questions that the students will answer to demonstrate their comprehension of the reading material.
Explore It!
Students will be working in pairs to better understand motion graphing. In this station, students become the objects as they conduct certain tasks and record their movements on a graph. Students will follow the steps and record their observations on their lab sheet.
Research It!
The research station will allow students to explore an interactive web page helps them to understand motion graphing. Students will follow the instruction from the task cards that will show how a graph interprets motion with a person riding a bike. Students will be instructed to complete a few tasks and record answers on their lab sheets.
Organize It!
Students at this station will match scenarios of certain movements with their corresponding graph that represents that movement. Once students have completed their organization, the teacher will check their understanding.
Illustrate It!
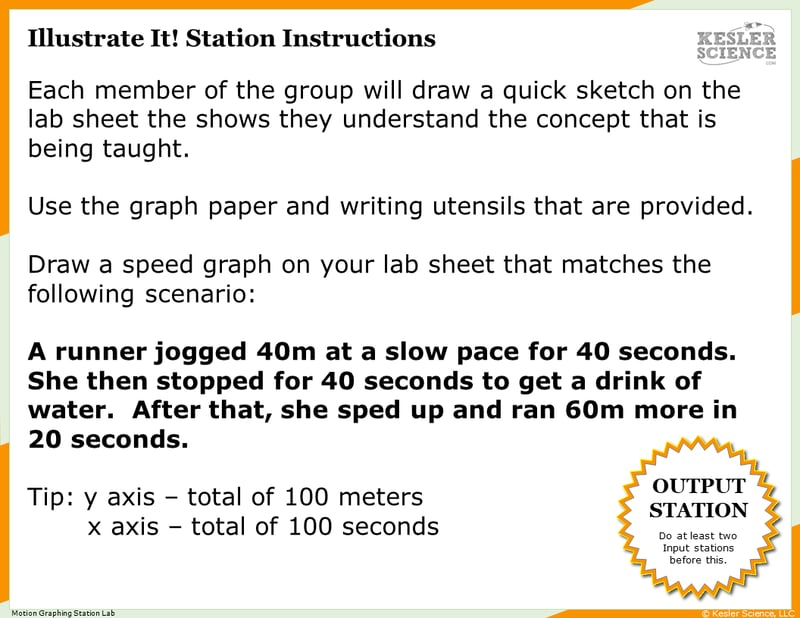
Your visual students will love this station. Students are to draw a picture that demonstrates their knowledge of motion graphing. They will need to design a graph that represents the short scenario that describes some sort of movement.
Write It!
Students who can answer open-ended questions about the lab truly understand the concepts that are being taught. At this station, the students will be answering three task cards: What does a flat, horizontal, line represent on a speed graph (distance and time)? Can a graph ever have a straight vertical (up and down) line on a speed graph (distance and time)? Make up a scenario that would match the graph on the picture.
Assess It!
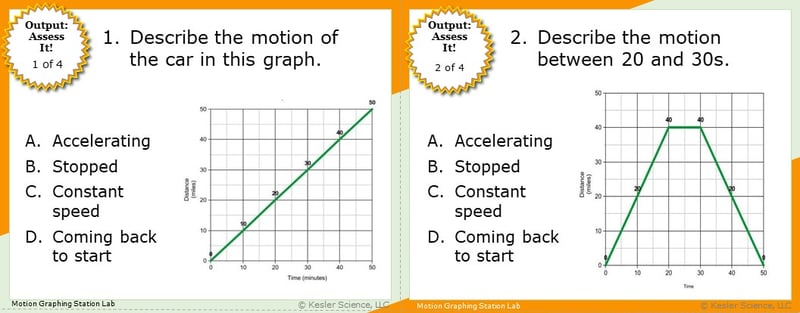
The Assess It station is where students will go to prove mastery over the concepts they learned in the lab. The questions are set up in a standardized format with multiple choice answers. Some questions include: Describe the motion of the car in the graph. Describe the motion between 20 and 30 seconds. Describe the motion at position A and B. Describe the motion of the car on this graph.
Challenge It! - Bonus Station
Early finishers and advanced students will love the extension activities in this station. Four activity choices offer them ways to expand their learning through mini-games and mini-projects.
Estimated Class Time for the Exploration: One or two 45-minute class periods
EXPLANATION
The explanation activities will become much more engaging for your class once they’ve completed the exploration station lab. During the explanation piece of the lesson, the teacher will be clearing up any misconceptions their students may have about motion graphing with a variety of materials. These materials include on-level and modified versions of the interactive presentation (may be used individually or projected), anchor charts, and paper or digital interactive notebook activities. If you have students that need modified notes, the 5E lessons come equipped to help give every student access to the lesson.

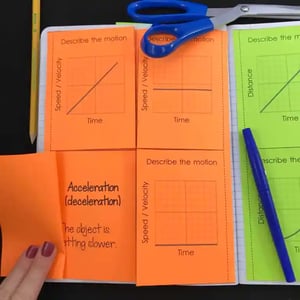
Interactive notebook samples: Above-left is a digital INB activity slide; above-right is an example of the paper INB activities.
The students will also be interacting with their journals while taking notes from the PowerPoint. If you have students that need modified notes, the 5E lessons come equipped to help give every student access to the lesson.
Estimated Class Time for the Exploration: Two or three 45-minute class periods
ELABORATION
The elaboration section of the 5E method of instruction gives students choices that allow them to prove they’ve mastered the concepts behind the lesson. When students are given a choice, they’re much more enthusiastic and invested in the project than they are when their teachers choose their projects for them. There are a total of nine choices to demonstrate understanding of motion graphing. A separate set of choices that offer more teacher support are also available for students that need them. Rubrics guide students to doing their best work and assist in grading.

Estimated Class Time for the Elaboration: Two or three 45-minute class periods (can also be used as an at-home project)
EVALUATION
The final piece of the 5E model is to evaluate your students' comprehension. Included in every 5E lesson is a homework assignment, assessment, and modified assessment. Research has shown that homework needs to be meaningful and applicable to real-world activities in order to be effective. When possible, I like to give open-ended assessments to truly gauge the student’s comprehension.
Estimated Class Time for the Elaboration: One 45-minute class period
DOWNLOAD THE FULL LESSON NOW
Download Over $100 in FREE Resources
For Middle School Science
Simply create a login below and gain immediate access to a selection of our Kesler Science product line worth $100 - for FREE. There's a full version of every product type! You'll also join tens of thousands of middle school science teachers who receive timely tips and strategies straight to their inbox.


