
8 hands-on stations for teaching human activities and climate
A station lab is a student-led activity where small groups rotate through 8 stations (plus a 9th challenge station for early finishers) at their own pace during one to two class periods. You become a facilitator instead of a lecturer. You walk around, spot-check, and break misconceptions while kids work through the rotation.
The Human Activities and Climate Station Lab has four input stations (where students take in new info on greenhouse gases, deforestation, and urbanization) and four output stations (where they show what they learned). Here's what's at each one.
4 input stations: how students learn about human activities and climate
A short YouTube video covers the major greenhouse gases, the human activities that have increased atmospheric CO2, and the outcomes of rapid climate change. Students answer three questions on the answer sheet. This is a quick primer station to set up the heavier reading and lab work.
A one-page passage called "What Changed the Statue of Liberty?" hooks kids with the copper-to-teal color change, then walks them through how burning fossil fuels causes acid rain, how deforestation removes a natural carbon sink, and how urbanization adds pollutants to air and water. Three multiple-choice questions and a vocabulary task follow. Comes in two reading levels (Dependent and Modified) plus a Spanish version.
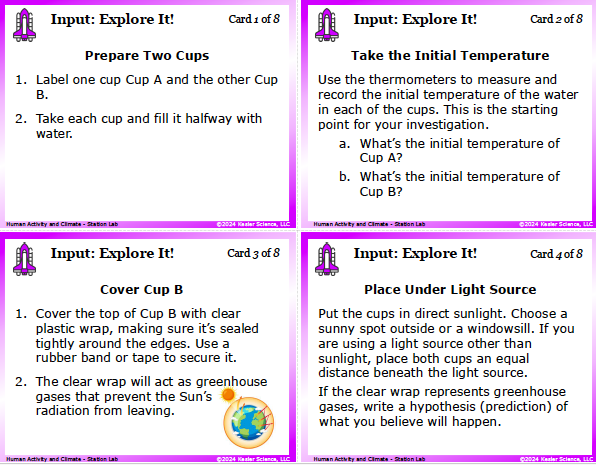
This is the heart of the lab. Students build a working greenhouse-effect model. Two cups of water sit side by side. One is uncovered (Cup A). One is sealed with clear plastic wrap (Cup B), which acts as the greenhouse gases. Both go in direct sunlight. Students measure starting temperatures, write a hypothesis, wait, and then measure final temperatures. Cup B (with the plastic wrap trapping heat) ends up several degrees warmer. They explain how this models the actual greenhouse effect on Earth. Quick to set up, dramatic results, and the kind of demo that gets remembered.
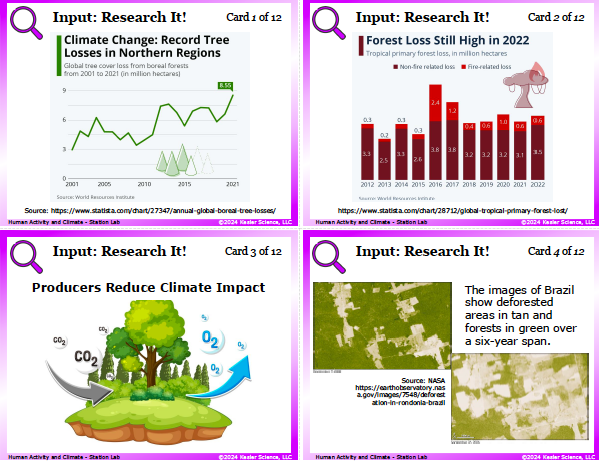
Students examine 12 reference cards: a graph of record boreal tree losses from 2001 to 2021, a Forest Loss Still High in 2022 graph showing fire vs. non-fire tree loss, a Producers Reduce Climate Impact infographic, NASA satellite images of Brazil deforestation, and short passages on evapotranspiration, forest shade, reasons for deforestation, and wildfires. Seven questions ask them to spot trends in the tree-loss data, predict temperature changes, explain why trees are carbon sinks, and decide whether reduction efforts should target fire or non-fire tree loss.
4 output stations: how students show what they learned
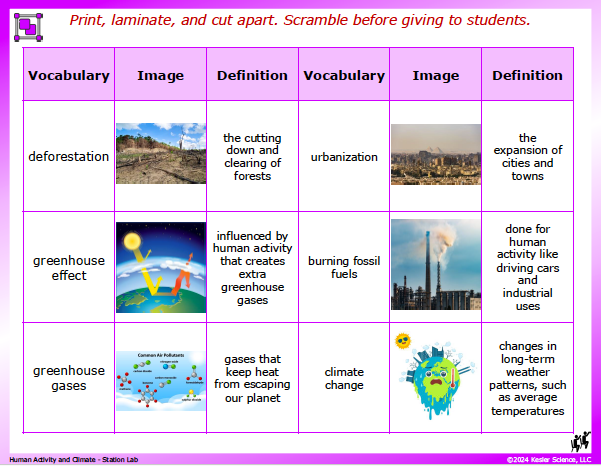
A 3-column card sort: Vocabulary, Image, Definition. Students match six vocabulary cards (deforestation, urbanization, greenhouse effect, burning fossil fuels, greenhouse gases, climate change) with their image and their plain-English definition. The image cards are a real visual aid for kids who learn better when terms have pictures attached. Easy to spot-check at a glance.
Students draw the greenhouse effect with three labeled colored arrows: solar radiation hitting Earth, heat bouncing off the surface, and greenhouse gases trapping the bouncing heat. They label the Sun, Earth, and greenhouse gases. This catches kids who can use the words but can't actually picture how the effect works. Drawing it locks it in.
Three open-ended questions. The first one is the one kids remember: how does running an air conditioner (powered by burning natural gas) make the heat problem worse? The second asks how forests regulate temperature. The third asks them to review their own daily habits and propose changes. This is the writing practice middle schoolers need and rarely get in science class.
Eight multiple-choice and fill-in-the-paragraph questions tied to TEKS 8.11B vocabulary (forest, greenhouse gases, habitable, deforestation, urbanization). Includes a deforestation-and-greenhouse-gas-concentration question, an urbanization scenario question, and a fossil fuel and greenhouse effect question. The fill-in paragraph weaves all five vocabulary words together. If you're grading the lab, this is the easiest station to grade.
Bonus Challenge It! station for early finishers
Four optional extensions: write a future-world Dear Diary entry about climate impacts, design a Two Truths and a Lie game on human activities and climate, create a Make a Difference flyer, or design three vinyl sticker concepts for a water bottle that raise awareness of deforestation, urbanization, and the greenhouse effect. Requires teacher approval before they start.
How this fits into a complete human activities and climate unit
This Station Lab is the Explore day of our full Human Activities and Climate Complete 5E Lesson for TEKS 8.11B. The complete two-week unit follows the 5E method of instruction and includes an Engage hook, the Human Activities and Climate Station Lab for Explore, PowerPoint slides and interactive notebook pages for Explain, student choice projects to Elaborate, and an Evaluate assessment.
Most teachers grab the full 5E because the Station Lab lands hardest with the days around it. But if you just need a strong hands-on day on greenhouse gases, deforestation, and urbanization, the Station Lab on its own does the job.

Get this human activities and climate activity

Or if you want the full two-week experience with the Engage hook, Explain day, Elaborate extension, and Evaluate assessment all included:
(Station Lab is included)
Frequently asked questions
What does TEKS 8.11B cover?
Texas TEKS 8.11B asks 8th grade students to use scientific evidence to describe how human activities can influence climate. Specifically: the release of greenhouse gases (mostly from burning fossil fuels), deforestation (which removes a natural CO2 sink), and urbanization (which adds heat and pollutants). Students should be able to look at a real-world example and explain the climate impact using data.
How is this different from TEKS 8.11A (Natural Events and Climate)?
TEKS 8.11A covers natural events that affect climate (volcanoes, meteors, ocean currents, the natural greenhouse effect). TEKS 8.11B covers what humans add on top of that natural baseline. Most teachers run them back-to-back in this order so kids see the natural system first and then the human amplification.
How long does this human activities and climate activity take?
One to two class periods (45 to 110 minutes total). The Explore It! cup-and-plastic-wrap experiment needs 30+ minutes of sunlight to give clean data, so plan for two periods the first time. Once your class has the routine down, most groups can finish all 8 stations in one period.
Do I need to provide my own materials?
Yes, but everything is cheap. Plastic cups, plastic wrap, rubber bands or tape, and thermometers. Total cost for a class of 30 (if you don't already have these): under $15. The Watch It! station also needs a device with internet.
Can I use this in a 1:1 digital classroom?
Yes. The full digital version (PowerPoint or Google Slides) works in 1:1 classrooms and Google Classroom. The Explore It! greenhouse-effect demo is the only part that really needs physical materials; everything else (reading, research, organizing, illustrating, writing, assessing) works fully on a device.