
8 hands-on stations for teaching natural events and climate
A station lab is a student-led activity where small groups rotate through 8 stations (plus a 9th challenge station for early finishers) at their own pace during one to two class periods. You become a facilitator instead of a lecturer. You walk around, spot-check, and break misconceptions while kids work through the rotation.
The Natural Events and Climate Station Lab has four input stations (where students take in new info on volcanoes, meteor impacts, ocean currents, and greenhouse gases) and four output stations (where they show what they learned). Here's what's at each one.
4 input stations: how students learn about natural events and climate
A short YouTube video (stop at the 5:20 mark) covers the largest CO2 storage center on Earth, why warmer oceans push the climate hotter, and the major greenhouse gases. Students answer three questions on the answer sheet. This station gets kids primed before they hit the heavier reading and data analysis stations.
A one-page passage called "Natural Events and Climate" opens with the 2024 Sundhnúkur eruptions in Iceland and walks students through volcanoes, meteor impacts, the Gulf Stream, and the natural release and absorption of greenhouse gases. Three multiple-choice questions and a short vocabulary task follow. Comes in two reading levels (Dependent and Modified) plus a Spanish version.
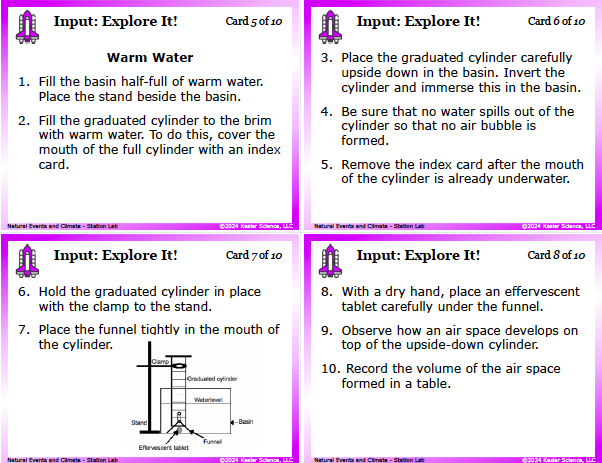
This is the heart of the lab. Students run a quantitative experiment that models how warming oceans hold less CO2. They invert a water-filled graduated cylinder in a basin, drop in an effervescent tablet under a funnel, and measure how much gas (air space) builds up. They run it once with cold water, once with warm water, and compare the volumes. Then they explain what a warming ocean means for the role of oceans as a CO2 sink. By the end, they've connected lab data to a real climate-feedback loop.
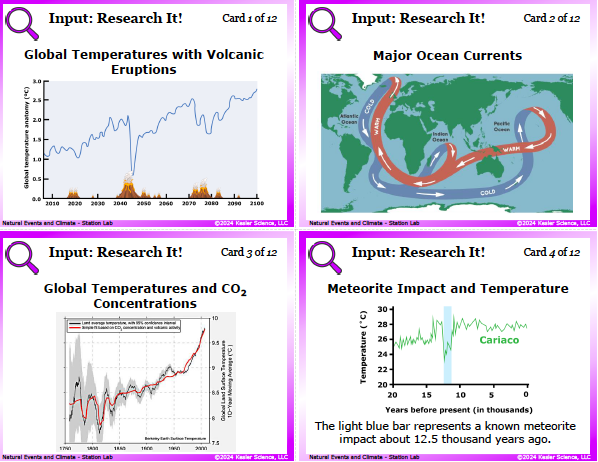
Students examine 12 reference cards: a graph of global temperatures alongside major volcanic eruptions, a Major Ocean Currents map, a Berkeley Earth global temperature and CO2 graph, a Cariaco temperature record showing a meteorite impact 12,500 years ago, a side-by-side natural vs. human-enhanced greenhouse effect diagram, and short passages on short-term and long-term climate change. Six questions ask them to spot patterns in the data, describe how the greenhouse effect works, and predict how Alaska glacier melt could shift Australia's climate through the ocean current system.
4 output stations: how students show what they learned
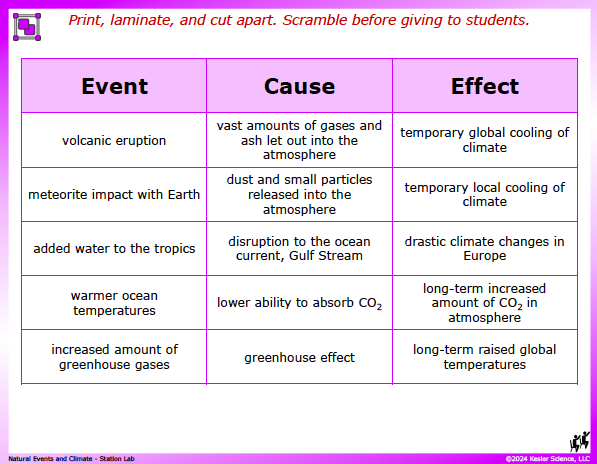
A 3-column card sort: Event, Cause, Effect. Kids match volcanic eruption to gases and ash to temporary global cooling, meteorite impact to dust and particles to local cooling, added water to the tropics to disrupted Gulf Stream to drastic European climate changes, warmer ocean temperatures to lower CO2 absorption to long-term CO2 increase, and increased greenhouse gases to greenhouse effect to long-term raised temperatures. Easy to spot-check at a glance.
Students draw a volcanic eruption climate impact diagram. They include the ash cloud, label the specific gases released (sulfur dioxide, CO2), use arrows to show the Sun's rays bouncing off the ash and gases, and draw a thermometer before and after to show the cooling effect. This catches kids who say "volcanoes warm the climate" and forces them to defend the actual physics.
Three open-ended questions: how volcanic eruptions affect climate, how ocean currents distribute heat globally and influence weather and climate, and how rising ocean temperatures and the greenhouse effect are connected. This is the writing practice middle schoolers need and rarely get in science class.
Eight multiple-choice and fill-in-the-paragraph questions tied to TEKS 8.11A vocabulary (atmosphere, climate, global cooling, greenhouse gases, ocean currents). Includes "how do volcanoes lead to global cooling," a global conveyor belt question, and a warming-oceans-and-CO2-release question. The fill-in paragraph weaves all five vocabulary words together. If you're grading the lab, this is the easiest station to grade.
Bonus Challenge It! station for early finishers
Four optional extensions: design a Superhero or Supervillain trading card for a greenhouse gas (with chemical formula and origins), build a vocabulary word search, research careers that work with volcanoes or ocean currents, or use earth.nullschool.net to observe live ocean currents and sea surface temperature anomalies. Requires teacher approval before they start.
How this fits into a complete natural events and climate unit
This Station Lab is the Explore day of our full Natural Events and Climate Complete 5E Lesson for TEKS 8.11A. The complete two-week unit follows the 5E method of instruction and includes an Engage hook, the Natural Events and Climate Station Lab for Explore, PowerPoint slides and interactive notebook pages for Explain, student choice projects to Elaborate, and an Evaluate assessment.
Most teachers grab the full 5E because the Station Lab lands hardest with the days around it. But if you just need a strong hands-on day on natural events and climate, the Station Lab on its own does the job.

Get this natural events and climate activity

Or if you want the full two-week experience with the Engage hook, Explain day, Elaborate extension, and Evaluate assessment all included:
(Station Lab is included)
Frequently asked questions
What does TEKS 8.11A cover?
Texas TEKS 8.11A asks 8th grade students to use scientific evidence to describe how natural events influence climate. Those events are volcanic eruptions (which cool the climate by blocking sunlight), meteor impacts (which cool locally and have caused global change in deep time), abrupt changes in ocean currents like the Gulf Stream, and the natural release and absorption of greenhouse gases. Students should be able to look at climate data and connect a temperature change to a likely cause.
How is this different from TEKS 8.11B (Human Activities and Climate)?
TEKS 8.11A covers natural events. TEKS 8.11B covers human activities (deforestation, urbanization, burning fossil fuels). Most teachers run them back-to-back so kids see the natural system first and then the human amplification on top of it. Both standards use scientific evidence as the backbone.
How long does this natural events and climate activity take?
One to two class periods (45 to 110 minutes total). The Explore It! cold-and-warm water experiment is the longest part, so plan for two periods the first time. Once your class has the routine down, most groups can finish all 8 stations in one period.
Do I need to provide my own materials?
The Explore It! station needs effervescent tablets, a graduated cylinder, a basin, a funnel, a ring stand and clamp, and access to warm and cold water. If your school has a basic chemistry kit you already have most of it. Total cost for the consumables (tablets) is under $10 for a class of 30. The Watch It! station also needs a device with internet.
Can I use this in a 1:1 digital classroom?
Yes. The full digital version (PowerPoint or Google Slides) works in 1:1 classrooms and Google Classroom. The Explore It! warm-and-cold water experiment is the only part that really needs a physical setup; the rest of the rotation works fully on a device.