
Inside the Classifying Stars 5E Lesson
The 5E instructional model walks students through five phases: Engage, Explore, Explain, Elaborate, and Evaluate. It flips the traditional lecture-first sequence on its head. Students explore a concept hands-on before you ever explain it, which means by the time you do explain it, they have something to hook the vocabulary onto.
I switched to the 5E model years ago and stopped going back. Kids retain more, ask better questions, and stop staring at me waiting to be told the answer. The Classifying Stars 5E Lesson is built on this framework from start to finish. Here's how it plays out across the five phases.
🎯 Engage
Day one is a teacher-led hands-on H-R diagram sort. Each student (or small group) gets a blank H-R diagram and a deck of star cards (Sun, Sirius, Betelgeuse, Rigel, Proxima Centauri, and a white dwarf). Following the step-by-step teacher directions, they place each card on the diagram based on color and brightness, then we pull the class together to circle the main sequence band, the giant region, and the white dwarf corner.
By the end of the period, kids have built the diagram with their own hands and can talk about why a blue star sits in the upper left and a red dwarf sits in the lower right. Nobody has heard a star life cycle lecture yet. That's the point. They're walking into the rest of the unit with a working mental map, not a memorized chart.
What's included in the Engage:
- Teacher directions for the H-R diagram star-card sort
- Printable student diagram sheet and star cards
- Answer key for the discussion questions
- Four learning objective slides (standard verbatim, "describe, compare, and classify" highlighted, "I CAN...", and "WE WILL...")
- An illustrated Space Science Word Wall in English and Spanish covering the full unit vocabulary
🔬 Explore
The Classifying Stars Station Lab is the heart of the Explore phase. Students rotate through 8 stations (plus a 9th challenge station for early finishers) over one class period. The Station Lab is split into four input stations (where kids take in new information) and four output stations (where they show what they learned).
The four input stations:
- 🎬 Watch It! — Students watch a short video on the star life cycle and the H-R diagram and answer guided questions.
- 📖 Read It! — A one-page reading passage on stellar classification and spectral types at two differentiated levels, with a Spanish version included.
- 🔬 Explore It! — The hands-on H-R diagram task where students plot a set of real stars by temperature and luminosity and identify the main sequence, giants, and white dwarfs.
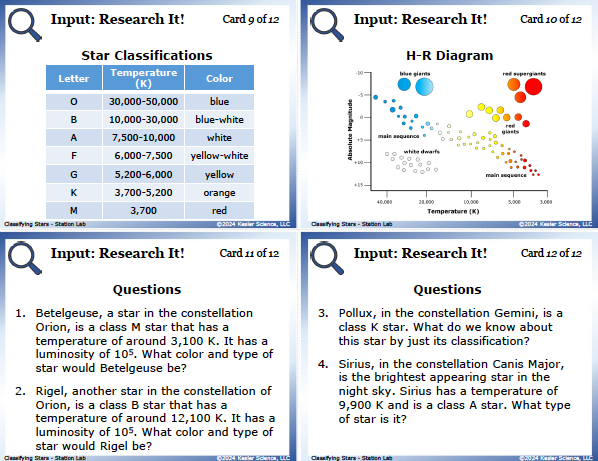
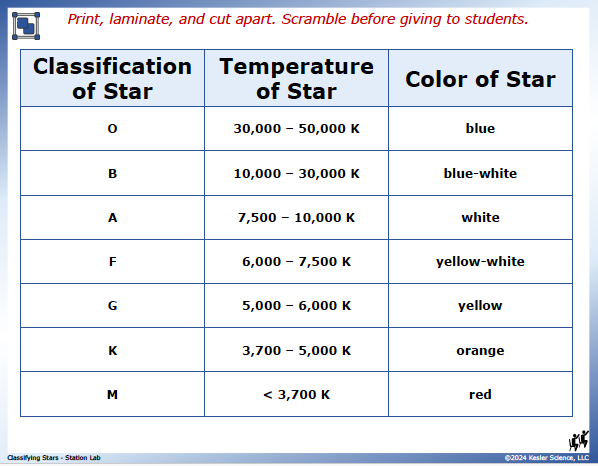
- 💻 Research It! — Reference cards with the spectral types (O, B, A, F, G, K, M), temperature ranges, and a life cycle flowchart for low-mass and high-mass stars.
The four output stations:
- 📋 Organize It! — A card sort where students place stars under the right life cycle stage (nebula, protostar, main sequence, red giant, white dwarf, supernova, neutron star, black hole).
- 🎨 Illustrate It! — Students draw the life cycle of a low-mass star and a high-mass star side by side and label each phase.
- ✍️ Write It! — Three open-ended questions in complete sentences (this is where you see who really gets the difference between brightness and luminosity).
- 📝 Assess It! — A short formative check with multiple choice and a fill-in-the-blank vocabulary paragraph.
Print and digital versions are both included. If you want the full breakdown of what happens at every single station, what students produce, and how to set it up, that's in our dedicated Station Lab post.
→ Read the full Classifying Stars Station Lab walkthrough 8 stations, materials list, teacher tipsThe Station Lab is included in the full 5E lesson. You don't need to buy it separately if you're getting the whole unit.
📚 Explain
Here's the real payoff of doing the Engage and Explore before the Explain: by the time kids hit this phase, they've already placed real stars on an H-R diagram and walked the life cycle phases with their hands. They have a working understanding before you ever start naming things. The discussions get deeper, the questions get sharper, and you spend less time defining and more time pushing their thinking.
The Classifying Stars Presentation walks 8th graders through the full scope of TEKS 8.9A, one concept at a time, with diagrams and real-star images on nearly every slide. The deck opens with the Essential Questions (can you describe the life cycle of a star, and how do we use the H-R diagram to compare and classify stars), and then builds out the story from raw materials to final stage. Stars are born inside interstellar mediums, thinly spread clouds of gas (mostly hydrogen) and dust (mostly carbon and silicon). Gravity pulls these materials together into nebulas, the "star nurseries" where new stars form. Inside a nebula, regions of denser gas and dust collapse into a protostar. When the core of a protostar reaches around 15 million degrees Celsius, nuclear fusion kicks in and hydrogen begins fusing into helium. A star is born.
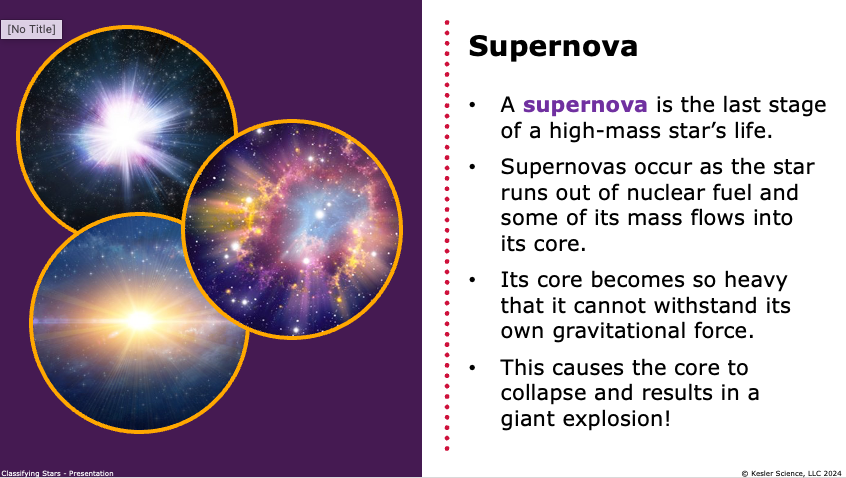
From there the deck splits the life cycle into two paths based on mass. Low-mass (average) stars like the Sun spend most of their lives on the main sequence as cooler, reddish or yellowish stars. When their hydrogen runs out, they swell into red giants, then shed their outer layers as a planetary nebula, leaving behind a dense, incredibly hot white dwarf. Eventually that white dwarf cools into a black dwarf, no longer emitting heat or light. High-mass stars burn hotter and bluer on the main sequence, expand into red supergiants or blue giants, and end their lives in a supernova. Whatever is left behind becomes either a neutron star (so dense that a teaspoon of its material would have a mass of over a billion tons) or, for the most massive stars, a black hole with gravity so strong that not even light can escape.
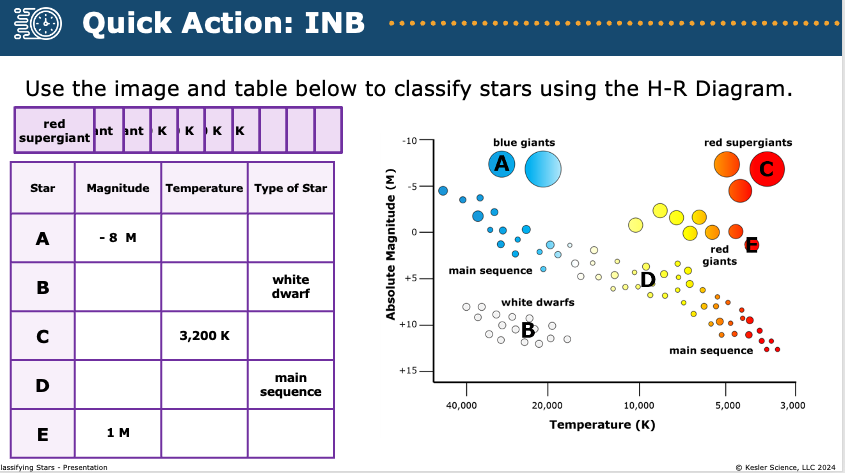
Once students have the full life cycle, the deck pivots to the H-R diagram itself. Temperature runs along the x-axis (hot stars on the left, cooler stars on the right, measured in Kelvin) and luminosity runs up the y-axis. Color is tied directly to surface temperature: blue stars are the hottest (often over 10,000 K), white and yellow stars sit in the middle, and red stars are the coolest (around 3,000 K). This is the opposite of what most students expect, so the deck spends time on it. Students also learn the difference between apparent magnitude (how bright a star looks from Earth) and absolute magnitude (how bright it would look from a standard distance of 10 parsecs), which clears up the misconception that the brightest-looking stars in our night sky are automatically the most powerful.
For every life cycle phase, students see a real image, a clear definition, and a placement on the H-R diagram. That repetition (different phases, same three views) is what bakes the describe and classify verbs of TEKS 8.9A into long-term memory.
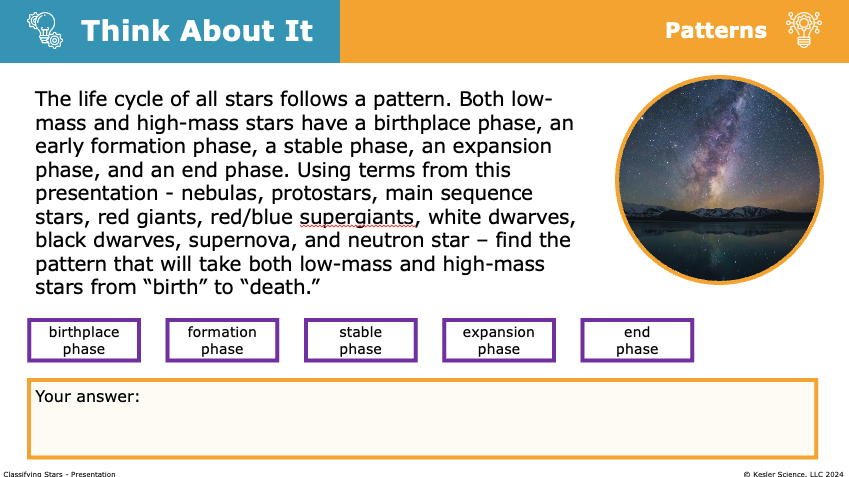
What makes the Classifying Stars Presentation different from a typical astronomy slideshow is that kids are doing something on almost every single slide. It's not a lecture deck. It's a participation deck. "Your answer:" prompts appear on most slides, Brain Breaks reset attention every few slides, Quick Action INB tasks (matching low-mass life cycle stages to images, matching high-mass life cycle stages, and using the H-R diagram to classify a set of stars) show up throughout, and Think About It prompts push deeper into bigger ideas like patterns across all stellar life cycles. The deck closes with a Check for Understanding tied back to the Essential Questions.
The Explain materials in this product include:
- An editable 35-slide Presentation at two differentiated levels (Dependent and Modified), works in PowerPoint or Google Slides
- A guided fill-in-the-blank student notes handout that mirrors the Presentation, with answer key
- A Paper Interactive Notebook (English and Spanish) students cut, fold, and glue into their notebooks
- A Digital Interactive Notebook at both levels with answer keys, for 1:1 classrooms or Google Classroom
The Explain runs across two class periods. The built-in Think About It prompts are where the real discussion happens, so let those breathe.
🛠️ Elaborate
The Elaborate phase is where students stretch what they learned about star classification and the life cycle and put it into a project of their choosing. In this 8th grade Earth and space lesson, that's a Student Choice Project board with six different project options plus a "design your own" pathway.
Students might build a 3-D model of the life cycle of a high-mass star with each stage labeled, create a children's book that walks a younger sibling through the journey from nebula to black hole, design a travel brochure for a tour of the H-R diagram ("come visit the main sequence, see the supergiants up close"), or record a news broadcast announcing the supernova of Betelgeuse. There are options for kids who love to write, kids who love to draw, kids who love to build, and kids who love to perform. Whatever the project, the point is the same: students apply star classification and stellar life cycles to a real-world artifact instead of a worksheet.
Choice is the whole point. By letting students pick how they show their thinking, you get more authentic work for TEKS 8.9A and you actually get to see what they understand about the H-R diagram and the star life cycle.
The rubric (the part teachers actually want)
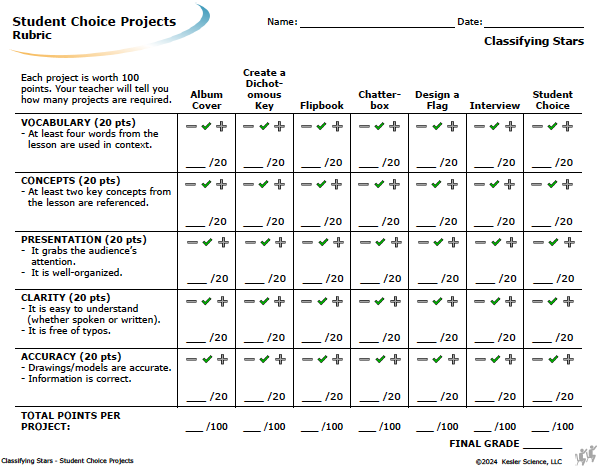
Every project, no matter which option a student picks, is graded on the same 100-point rubric. Five categories at 20 points each:
- Vocabulary (20 pts) — At least four words from the lesson are used in context.
- Concepts (20 pts) — At least two key concepts from the lesson are referenced.
- Presentation (20 pts) — The project grabs attention and is well-organized.
- Clarity (20 pts) — Easy to understand. Free of typos.
- Accuracy (20 pts) — Diagrams and models are accurate. The science is right.
The rubric uses a minus / check / plus shorthand on every row so you can grade a stack of projects quickly without re-reading every criterion.
Two differentiated versions in one file
The standard version is for students ready for independent application of star classification. The Reinforcement version is for students who need additional vocabulary or concept support. Three of the six options are swapped for projects with a tighter vocabulary tie-in, and "design your own" is replaced with "collaborate with the teacher" so kids aren't pitching cold.
✅ Evaluate
The Evaluate phase wraps the unit with a formal assessment. It's not all bubble-in. Several questions hand students an H-R diagram or a set of star images and ask them to identify the right region or stage and then describe why.
The full assessment has 12 questions across five formats:
- Multiple choice (4 questions) covering spectral types, the order of the star life cycle, color-temperature relationships, and the meaning of luminosity
- Hotspot / visual (2 questions) where students locate a specific star on the H-R diagram and identify the region (main sequence, giant, white dwarf) where a star with given properties belongs
- Multiselect (2 questions) where students choose all features that describe a red giant or all possible end states for a high-mass star
- Short answer (2 questions) on the difference between apparent and absolute magnitude and why color is a reliable clue to temperature
- Multipart scenario (2 questions) with a classroom debate where kids identify which student's reasoning about a star's classification is correct and which piece of H-R diagram evidence supports it
A modified version is included for students who need additional support. Fewer multiple-choice distractors, sentence-starter scaffolds on the short-answer items.
If you've taught all five phases, this assessment shouldn't surprise anyone. It's a chance for kids to show you they get it.
How everything fits together
If you want the whole experience (Engage hook, the Station Lab as the Explore, the Explain day with Presentation and interactive notebook, the Student Choice Elaborate, and the Evaluate assessment all in one download), that's the Classifying Stars Complete 5E Science Lesson.
If you only need the one-day hands-on activity, the Station Lab works as a standalone. Most teachers buy the full 5E because the Station Lab works harder when it's bookended by a strong Engage and a follow-up Explain. But both are honest options.

Get the Classifying Stars 5E Lesson

Or if you only need the one-day hands-on Station Lab:
(The Station Lab is included in the full 5E Lesson)
Frequently asked questions
Does this cover all of TEKS 8.9A?
Yes. The full standard is addressed across all five phases, with both the "describe the life cycle" and the "compare and classify using the H-R diagram" verbs baked into the Engage, Explore, and Elaborate activities.
What do my students need to know before this lesson?
A basic understanding that stars are giant balls of hot gas and that the Sun is a star. If your kids can describe what the Sun is and that other stars exist far away, they're ready.
How long does it take to teach?
Done with fidelity, about 10 class periods of 45 minutes each: one day for the H-R diagram Engage, two days for the Station Lab, two days for the Presentation and Interactive Notebook, three days for the Student Choice Project, and one to two days for review and the assessment. The product also ships with a compressed 8-day sample unit plan if you need to move faster.
Do I need special supplies?
No. Everything you need is in the download except colored pencils or markers and a device with internet for the slide deck and the Watch It! station. No telescopes, no labs to set up.
Does this work for digital classrooms?
Yes. Every component has a digital version. The Station Lab is fully digital-ready (Google Slides), the Presentation works in Google Slides, and the Student Choice Projects can be submitted as videos, slide decks, or written work.
Is this 5E lesson aligned to NGSS too?
It aligns most directly with MS-ESS1-3 (analyzing and interpreting data to determine scale properties of objects in the solar system) and parts of HS-ESS1-1 (the role of nuclear fusion in stars). Built TEKS-first, but the standards overlap meaningfully.