
8 hands-on stations for predicting tides
A station lab is a student-led activity where small groups rotate through 8 stations (plus a 9th challenge station for early finishers) at their own pace during one to two class periods. You become a facilitator instead of a lecturer. You walk around, spot-check, and break misconceptions while kids work through the rotation.
The Predicting Tides Station Lab has four input stations (where students take in new info on gravity, the Moon, and tide patterns) and four output stations (where they show what they learned). Here's what's at each one.
4 input stations: how students learn what causes tides
A short YouTube video introduces what tides are and what causes them. Three questions follow: what a tide is, what main influence affects Earth's tides, and why the biggest tides happen during full moon and new moon phases. The video is the right length to grab attention without losing focus, and it sets up the gravity-of-the-Moon idea before kids hit the model.
A one-page passage called "Predicting Earth's Tides" walks students through how the Moon (mostly) and the Sun (a little) pull on Earth's oceans through gravity. It explains why there are two high and two low tides each day, and the difference between spring tides (Earth-Moon-Sun lined up, gravitational pull is stronger) and neap tides (Earth-Moon-Sun at 90 degrees, gravitational pull is weaker). The vocabulary is bolded throughout (tide, high tide, low tide, spring tide, neap tide). Three multiple-choice questions follow, plus the vocab notes section. Comes in two reading levels (Dependent and Modified) plus a Spanish version.
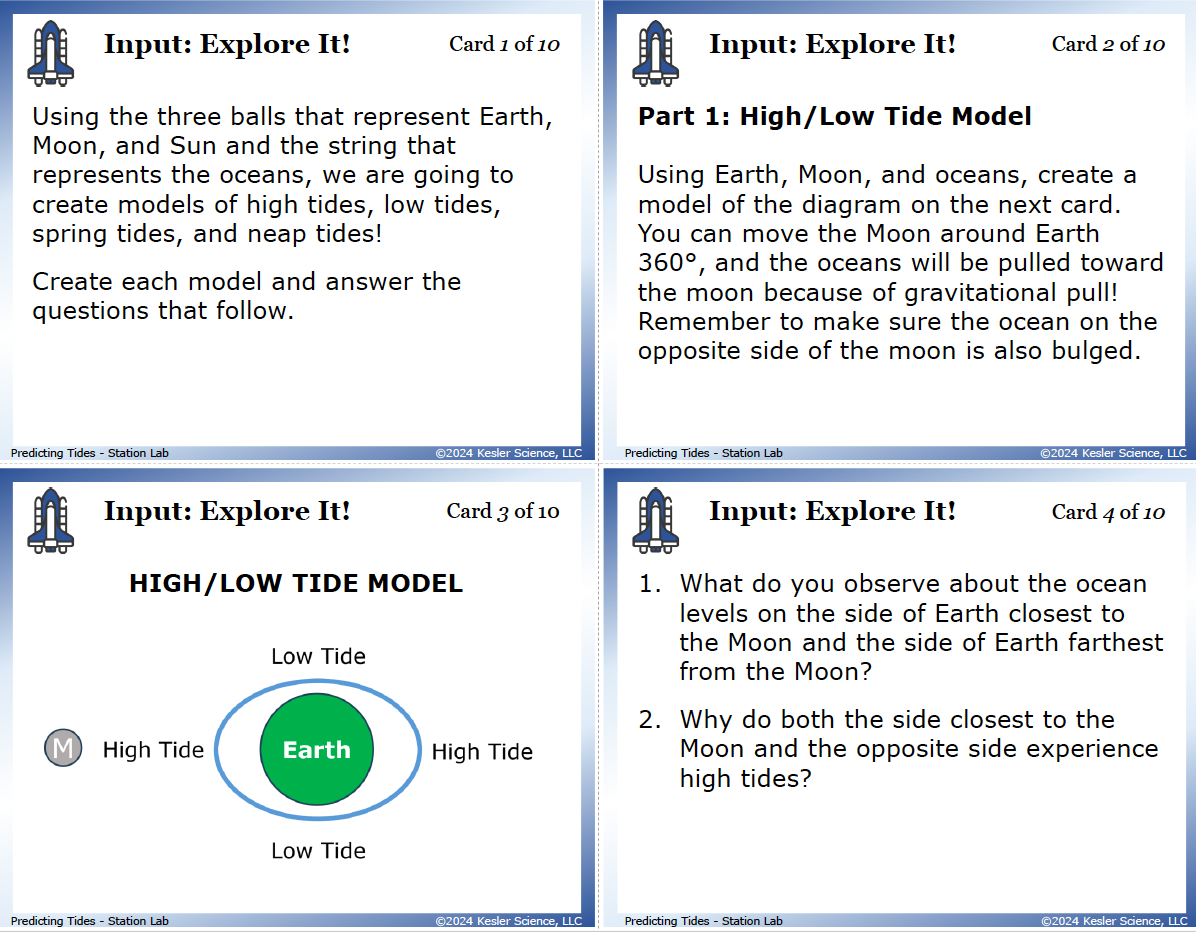
This is the heart of the lab. Three model-building parts. Part 1: Students use Earth, Moon, and a string "ocean" to model high and low tides, moving the Moon around Earth and watching the ocean bulge toward the Moon (and on the opposite side of Earth). Part 2: Add the Sun and line up Earth-Moon-Sun to create a spring tide model. Part 3: Move the Moon to a 90-degree angle from the Sun for the neap tide model. Seven questions tie back to position, gravitational pull, and how spring and neap tides compare. The opposite-side-of-Earth bulge is the moment kids' eyes light up.
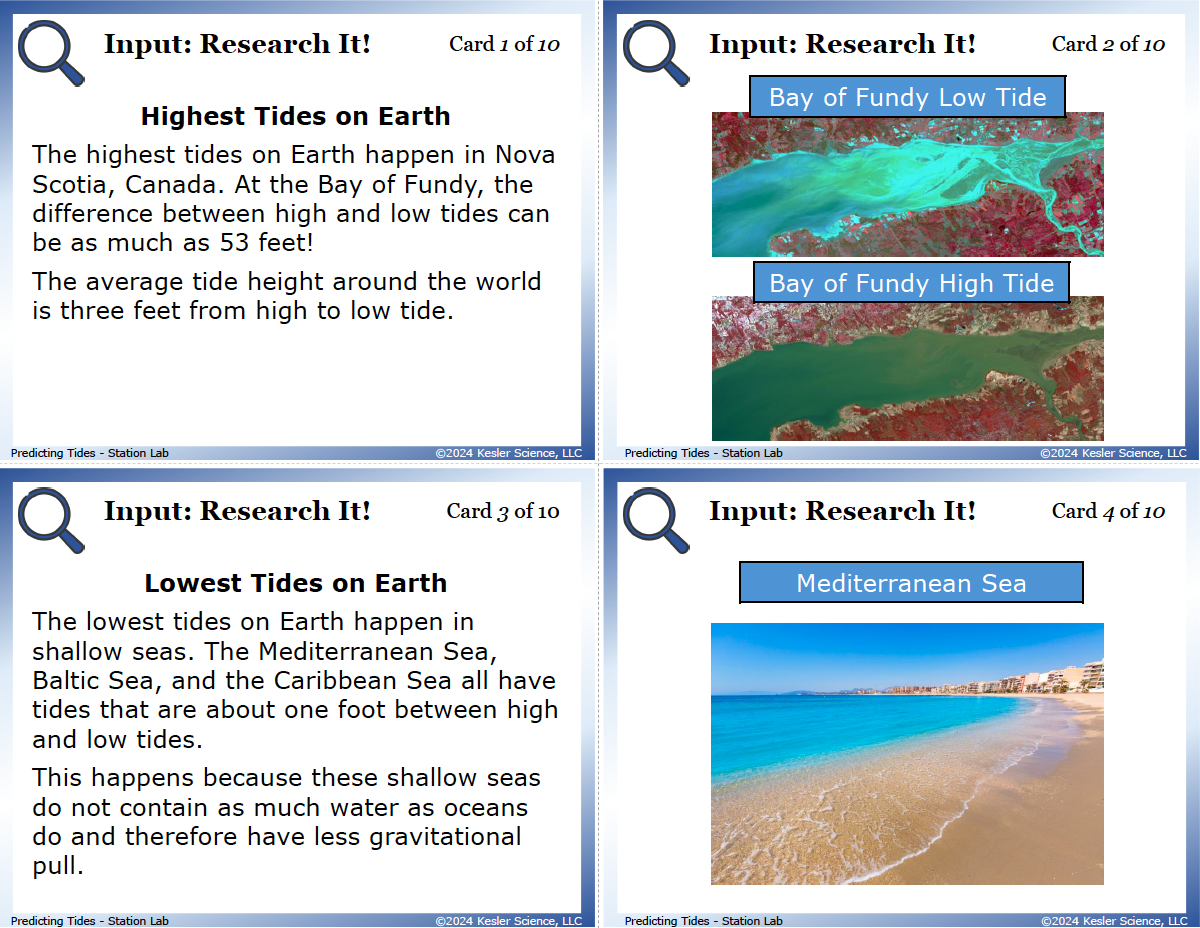
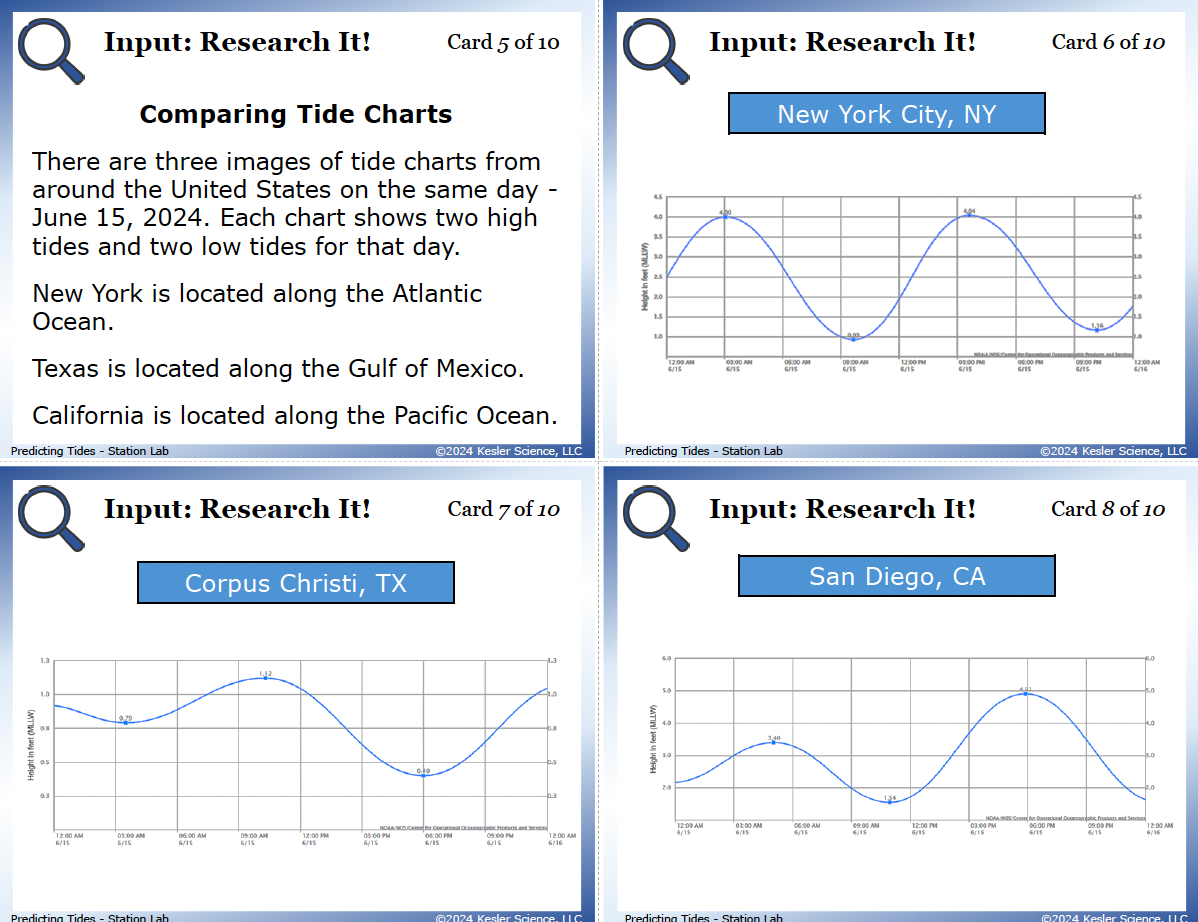
Students examine 10 reference cards. The first set covers tide extremes: the Bay of Fundy in Nova Scotia has the highest tides on Earth (up to 53 feet between high and low) while shallow seas like the Mediterranean, Baltic, and Caribbean only change by about a foot. The second set is real NOAA tide charts from June 15, 2024 for New York City (Atlantic), Corpus Christi (Gulf of Mexico), and San Diego (Pacific). Five questions check whether they can read the charts, identify the highest and lowest tides on that day, and explain why shallow seas have lower tides than deep oceans.
4 output stations: how students show what they learned
A two-column card sort. Kids match descriptions to either Spring Tide or Neap Tide. Examples: "tides are VERY high or VERY low" goes under Spring Tide, "low tides are higher than normal and high tides are lower than normal" goes under Neap Tide, "Earth, Moon, and Sun are lined up" goes under Spring Tide, "Earth, Moon, and Sun are at a 90 degree angle" goes under Neap Tide, "happens during the new and full moon" goes under Spring Tide, "happens during the 1st quarter and 3rd quarter moon" goes under Neap Tide. Easy to spot-check at a glance.
Students draw two labeled diagrams: the locations of Earth, Moon, and Sun during a spring tide (lined up) and during a neap tide (90-degree angle). They include the bulged ocean to show how gravity affects sea level. The diagrams are essentially the static version of what they built in Explore It!, which is why this station works so well after the model.
Three open-ended questions: describe how the gravitational pull of the Moon and Sun cause daily tides, explain the difference between a spring tide and a neap tide, and explain how we can predict daily tides on Earth (because we know exactly where the Earth, Moon, and Sun are at any given time). This is the writing practice middle schoolers need and rarely get in science class.
Eight multiple-choice and fill-in-the-paragraph questions tied to TEKS 6.9B vocabulary (tide, high tide, low tide, spring tide, neap tide). Includes what causes Earth's daily tides, which celestial object is most responsible (Moon, not Sun), how many high tides happen each day, and a fill-in paragraph that weaves all five vocab words together. If you're grading the lab, this is the easiest station to grade.
Bonus Challenge It! station for early finishers
Four optional extensions: list plants and animals that live in tidal zones and describe their adaptations, research the highest or lowest tides on Earth and explain the geography behind them, write an acrostic poem for "spring tide" or "neap tide," or build a four-page diagram flipbook showing high tide, low tide, spring tide, and neap tide. Requires teacher approval before they start.
How this fits into a complete predicting tides unit
This Station Lab is the Explore day of our full Predicting Tides Complete 5E Lesson for TEKS 6.9B. The complete two-week unit follows the 5E method of instruction and includes an Engage hook, the Predicting Tides Station Lab for Explore, PowerPoint slides and interactive notebook pages for Explain, student choice projects to Elaborate, and an Evaluate assessment.
Most teachers grab the full 5E because the Station Lab lands hardest with the days around it. But if you just need a strong hands-on day on tides, the Station Lab on its own does the job.

Get this predicting tides activity

Or if you want the full two-week experience with the Engage hook, Explain day, Elaborate extension, and Evaluate assessment all included:
(Station Lab is included)
Frequently asked questions
What does TEKS 6.9B cover?
Texas TEKS 6.9B asks 6th grade students to predict the cause of high and low tides on Earth as a result of the gravitational pull from the Moon and Sun. Students should be able to explain that tides are caused by gravity (mostly from the Moon), recognize that Earth has two high and two low tides per day, and distinguish between spring tides (Earth-Moon-Sun lined up) and neap tides (Earth-Moon-Sun at a 90-degree angle).
Is this kids' first time meeting spring and neap tides?
Yes for most 6th graders. They've heard about "the tide coming in" since they were little, but the words "spring tide" and "neap tide" are brand new. The Read It! passage introduces them in bold, the Watch It! video provides the visual anchor, and the Explore It! three-part model makes the geometry physical. By the end, kids can predict whether a date is a spring tide or a neap tide just from knowing the Moon phase.
How long does this predicting tides activity take?
One to two class periods (45 to 110 minutes total). The Explore It! station's three-part model is the longest piece, so plan for two periods the first time you run a station lab. Once your class has the rotation routine down, most groups can finish all 8 stations in one period.
Do I need a lot of supplies for this?
Three balls per group (any size that lets kids tell Earth, Moon, and Sun apart) and some string. Total cost for a class of 30: under $15 if you're starting from nothing, and the materials are reusable forever. The Watch It! station also needs a device with internet.
Can I use this in a 1:1 digital classroom?
Yes. The full digital version (PowerPoint or Google Slides) works in 1:1 classrooms and Google Classroom. Students drag digital Earth, Moon, and Sun objects in the slides instead of physically modeling. The Explore It! ball-and-string activity is harder to digitize. The NOAA tide charts at the Research It! station are easy to extend digitally with live tide data from any coastal city.